U.S Economic and Property Market Outlook
Lower For Longer No Longer: Changing Yields, Property Valuations, and Investment Opportunities
“When someone shows you who they are, believe them the first time.”
- Maya Angelou
The Federal Reserve spent much of 2022 attempting to convince financial markets they are committed to controlling inflation, pulling forward the pace of interest rate increases and raising the expected so-called “terminal rate” for overnight borrowing at each of the last five monetary policy meetings of the Federal Open Market Committee (FOMC). More importantly the FOMC increased the effective Fed Funds rate by more than 400 basis points in less than one year, the fastest and largest increase in the policy rate since the early 1980s.
FIGURE 1
CHANGE IN EFFECTIVE FED FUNDS RATE OVER PAST 365 DAYS

Source: Federal Reserve Bank of St. Louis (FRED)
This rapid change in the yield environment and its implications for slower near-term growth or recession showed up quickly in the value of publicly traded risk assets with stock, bond and REIT prices typically declining 15%-25% during 2022. For its part, private market valuations for property, as represented by the NCREIF Property Index (NPI) or the Open-Ended Diversified Core Equity (ODCE) fund index, have only just begun to reflect these changes1 with both indices thus far recording valuation declines of approximately 5%.
FIGURE 2
TOTAL RETURN INDEX, 2021 Q4 = 100

Source: FactSet, NCREIF
The lagged response of private equity valuations relative to public markets has been observed in prior valuation adjustment periods. For example, during the financial crisis, publicly traded REIT values began declining during 2007 before reaching a trough during the first quarter of 2009. In contrast, NPI valuations did not begin to decline until the second quarter of 2008 and did not reach a cyclical trough until the first quarter 2010, i.e., a four-quarter lag relative to the public REIT market. If history is an indicator, these private and public values tend to meet somewhere in the middle (see Figure 3).
FIGURE 3
EQUITY REIT PRICE INDEX AND NPI CAPITAL VALUE INDEX, 1977 Q4 = 100

Source: NCREIF, NAREIT
Private market price adjustments are often elongated by limited market liquidity. Aggregate trading in the nation’s property markets began 2022 at a torrid pace, far ahead of the record 2021 pacing, before slowing sharply mid-year. Beginning at the end of the second quarter, financing for commercial properties became generally less available with lenders lowering allowable loan-to-value (LTV) ratios while also lowering assessment of value in most cases. At the same time, all-in borrowing costs increased, typically rising above the current property income yield (cap rate). As a result, overall property transaction pacing was nearly flat through the fourth quarter (see Figure 4).
FIGURE 4
CUMULATIVE TOTAL TRANSACTION VOLUME BY YEAR

Source: RCA/MSCI
All-in fixed interest rates facing commercial property borrowers have increased from extremely low borrowing costs of 2.5% to 3.0% during the depths of the pandemic to rates approaching or exceeding 6% today. With the typical property in the NCREIF Property Index currently valued at a current yield (cap rate) of roughly 4%, current borrowing costs are well above the income yield and simply do not work for many property investments at current valuations, unless the expected property fundamentals allow for underwriting significant future growth in property income.
FIGURE 5
IMPACT OF LEVERAGE ON PROPERTY YIELDS (%)

Source: NCREIF, American Council of Life Insurers (ACLI)
The disconnect between borrowing costs and valuation yields has occurred before. During the Global Financial Crisis of 2007-2009, leverage also turned negatively accretive and, in response, property yields were forced higher – despite the Federal Reserve aggressively cutting interest rates and injecting liquidity into the financial system. Today, this same force weighs on property valuations but with significant differences. First, the U.S. economy contracted sharply during 2008, losing roughly nine million jobs during 2008 and 2009 and greatly contracting property demand. Today, the U.S. economy is not yet in broad recession. Second, and perhaps most importantly, today the Federal Reserve is aggressively raising interest rates and draining liquidity.
Clearly, the yield on currently held properties (and, by extension, on properties that will trade in a re-priced market) will likely continue to rise over the course of 2023 with the usual uncertainties of how much, how fast and the degree to which increasing yields will come from rising property income (NOI) or declining property values. With the U.S. economy seemingly on the verge of a period of significantly slower economic growth or outright recession, the lion’s share of any rise in yields, in the short term, will likely come largely from property value decline and we expect property asset re-pricing to continue through most if not all of 2023.
Conclusion
While the near term will be largely characterized by broad asset re-pricing and challenging capital structures, the longer run investment environment following the current period may prove even more beneficial. Many investors, plan sponsors especially, have struggled over the past decade with an investment landscape defined by low or negative nominal and real yields. Following the financial crisis, central banks across the globe collectively distorted the cost of capital in pursuit of varying goals of financial system stabilization, economic growth, pandemic relief, and so on. If today’s coordinated normalization of yields, ostensibly in pursuit of price stability, ultimately gives way to a new normal of positive real sovereign yields, most investors will benefit greatly, in the mid- to longer term. If so, it may once again be possible to deploy capital into safer assets that achieve most if not all of investors’ required return (e.g., senior loans) or equity investments that do not require most or all return in the form of residual (e.g., core property).
Office
The office sector faces some of the stiffest headwinds among the major property types, with an elevated level of uncertainty among CRE investors regarding future values. Acceptance of the hybrid work model has become more entrenched in employee and employer expectations, which has structural implications for future demand as companies reevaluate the type, location, configuration and aggregate need for space. Employers are also starting to recognize that they may have been overly ambitious in their hiring practices. Layoff announcements have become more prevalent, especially among tech-oriented companies, perhaps pointing to a slowdown in aggregate employment. Whether the cause was aggressive competition for talent, future growth expectations, space utilizations shifts or other factors, the net impact on the office sector has been less demand for new space and a consolidation or downsizing of existing space from tenants.
Leasing volume (new and renewals) remained sluggish in 2022 tracking roughly 25-30% below pre-COVID levels with slower momentum in the second half of 2022. Brokers are reporting fewer tenants in the market looking for new space with added pressures coming from the sublease market; San Francisco and Seattle are the most notable negative outliers, while Boston is the outperformer benefitting from its life science exposure. In aggregate, net absorption of space fell by 5.9 msf in the fourth quarter across the markets tracked by CBRE after starting the year on a more positive note. In total, the office sector recorded a modest absorption gain of 3.6 million square feet (msf) in 2022, which is a far cry from the demand decline of nearly 100 msf over the previous two years. Barring a significant dip in economic conditions, there are some reasons to be optimistic or at least less pessimistic as companies gain clarity on how to better align their space needs.
Office vacancies climbed 30 basis points (bps) to 17.3% for the quarter according to CBRE-EA, continuing the pattern of rising rates albeit at a slower pace than 2021. Sublease space accounted for 230 bps of the vacancy totals. New supply has been a factor in pushing vacancy rates higher in select markets but not to the degree of previous cycles. Low space utilization and other dynamics related to assessing future space needs appear to be at the forefront along with economic pressures. New York, Washington, DC, and Boston delivered the most space in 2022, while Austin added nearly 5% to its inventory. Austin, Seattle, San Jose, Charlotte, Boston and Nashville have at least 5% of inventory still under construction, which may pose more of a problem going forward. That said, over the near-term, challenged financing conditions will make it difficult to add to these totals.
Investor and lender sentiment towards the office sector appears to have deteriorated over the past several months along with the expectation of deteriorating values or the uncertainty surrounding where exit cap rates will settle. The office sector is being viewed differently from the other property sectors given the remote work dynamic and the structural implications for aggregate demand. NCREIF reported a value decline of 5.9% in the fourth quarter for office after a modest 1.7% decline in the third quarter. From a borrower’s perspective, financing has become scarce and/or expensive with transaction volume dipping below $20 billion, or less than half a typical fourth quarter.
Overall, the summary views that we have put forth over the past few quarters have not changed materially. AEW Research reaffirms its belief that companies will embrace a more fully integrated hybrid work model that will translate into a reduction in aggregate demand. That said, it will take time to fully play out as firms assess the impact of the shifting work model on productivity, profitability and the ability to retain talent. Demand will likely be skewed toward quality space and location premiums, which begs the question of how commodity space, which dominates the market, will fare. In aggregate, our expectation is that vacancies will continue to rise through 2023. While the talent war appears to be cooling, suggesting companies may regain some leverage, we do not anticipate it will impact our outlook materially.
OFFICE MARKET FUNDAMENTALS

Source: CBRE-EA, as of Q4 2022
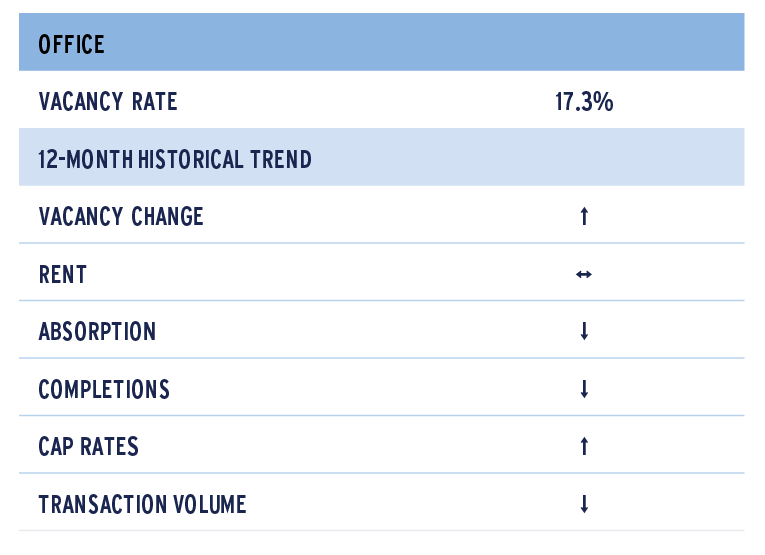
Source: CBRE-EA, NCREIF and RCA , as of Q4 2022
Apartment
A broad housing market slowdown is underway as economic uncertainty underpins demand for both for-sale and rental housing units. On the for-sale side, job insecurity and a rapid upward movement in interest rates yielded a 15% year-over-year (YOY) decline in new home sales in November, while existing home sales declined 34% on a YOY basis in December. To date, home prices remain up YOY, likely propped up by a lack of inventory. Indeed, at the current sales rate, the number of homes on the market equates to only 2.9 months of supply as current owners, with low-mortgage rates locked in, are reluctant to move. The outlook for the market is for a continued slowdown in the sector, with sales, starts and prices expected to trend downward. Home prices are projected to decline into 2025, yielding a peak-to-trough decline in the median existing home price of 11%; further, a full recovery in home prices is not expected until mid-2029.
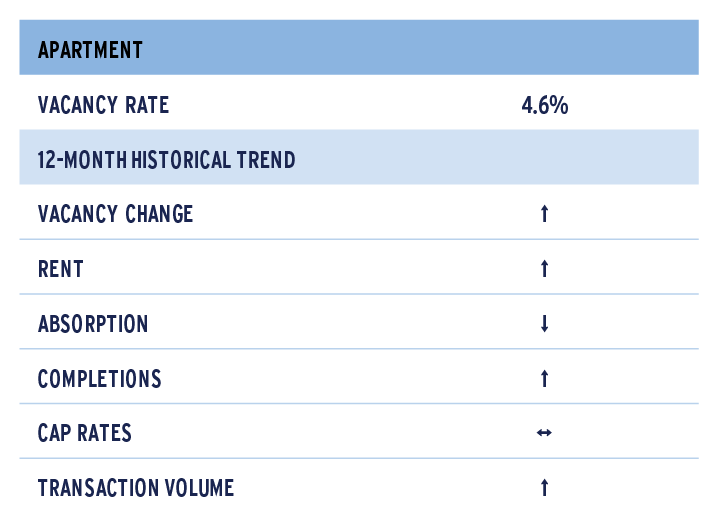
On the apartment side, meanwhile, demand has retrenched, with net absorption remaining negative for three consecutive quarters. With moderate demand in 2022 Q1 and negative demand for 2022 Q2 through 2022 Q4, net absorption was negative on an annual basis for 2022 with roughly 6,000 units being returned to the market. This is the first time since 2009 that demand has been negative on an annual basis. At the same time, completions have accelerated over the course of the year and topped 100,000 units in 2022 Q4, the only time deliveries have topped six digits. Vacancies, as a result, increased from only 2.4% in the first quarter to 4.6% in the fourth quarter. On a YOY basis, vacancies are up 200 basis points (bps) but remain below the 5.0% historical average since 2000.
Rent growth, meanwhile, has decelerated on a YOY basis and, for the first time since the pandemic, turned negative on a quarter-over-quarter (QOQ) basis. Overall, rents remained up 6.7% YOY but were down 0.8% QOQ. While rent growth has decelerated YOY, loss to lease remains positive and renewing leases are still rolling to higher rents, allowing net operating income (NOI) to continue to move higher.
By market, Sunbelt markets generally lead the way in terms of demand with Austin, Nashville, Greenville, Salt Lake City, Orlando and Charlotte ranking among the top 10 markets with the highest net absorption rates. Other Sunbelt markets with positive net absorption rates for the year include Miami, Jacksonville and Fort Worth. In all, only 24 markets reported positive net absorption for the year, while 39 markets reported flat or negative net absorption. The weakest markets included many smaller secondary or tertiary markets with Tucson, Memphis, Albuquerque, Detroit, Norfolk, Oklahoma City and Birmingham ranking in the bottom 10 for net absorption rate. Las Vegas and Riverside were the only two major markets ranking in the bottom 10. Overall, the bottom 10 in terms of demand reported a net absorption rate between -1.7% and -3.4%, while the top 10 reported a net absorption rate between 3.2% and 1.0%.
On the supply side, Austin, Greenville, Nashville, Salt Lake City, Charlotte, Orlando and Jacksonville were also among the top production markets with completions as a share of inventory ranging from 6.6% in Austin to 3.8% in Fort Worth. To put this in perspective, deliveries nationally totaled 2.1% of inventory. Again, smaller secondary or tertiary markets generally had the least supply although this is not surprising as they tend to be less dynamic economically relative to the growth leaders noted above.
The net result of the current demand and supply environment is an average YOY increase in vacancies of 200 bps nationally, but with a range from a high of nearly 400 bps in Phoenix and Tucson to a low of 30 bps in New York. Notably, all markets reported an uptick in vacancies over the course of the year. The smallest increases in vacancies were in more mature traditional markets like New York (30 bps); San Francisco (90); Newark (100); San Jose (110); Chicago (120); Boston (140); and Los Angeles (160), while markets in the Southwest and smaller southeastern markets reported the largest uptick in vacancies. Indeed, Phoenix (390); Tucson (390); Las Vegas (360); San Antonio (350); Jacksonville (340); Memphis (340); Fort Worth (330); Tampa (330); Atlanta (320); and Greensboro (320) reported the 10 largest increases in vacancies over the course of the year.
APARTMENT MARKET FUNDAMENTALS ARE MODERATING QUICKLY
(SELECT MARKETS, ROUGHLY TOP 40)

Source: CBRE-EA, as of Q4 2022
Going forward, continued economic softness and an ultimate recession coupled with still strong supply growth will lead to higher vacancies, additional softening in rents and ultimately a rollback in NOI. Performance will vary across markets, however, based on the current supply outlook. Today, there are 30 markets with 7.0% or more of supply under construction as a share of inventory, well in excess of the U.S. average of 4.4%. Austin leads the way at 16.1%, followed by Salt Lake City (12.9%); Nashville (11.8%); Raleigh (10.2%); Jacksonville (10.1%); Orlando (9.8%); Charlotte (7.9%); Dallas (7.9%); San Antonio (7.1%); and Atlanta (7.0%). Demand has been exceptionally strong in all of these markets in recent years, offsetting new construction, with the exception of Minneapolis. In a downturn, however, weakened demand will likely put strong downward pressure on rents and these aforementioned market bear watching.
Source: CBRE-EA, NCREIF and RCA, as of Q4 2022
Industrial
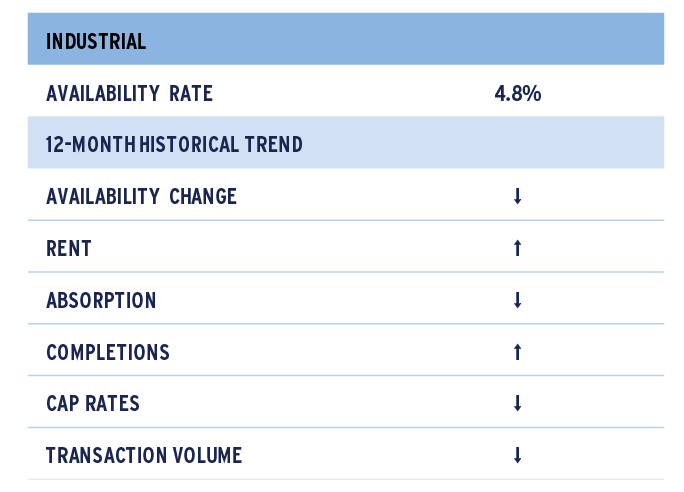
There was a slight easing in industrial market conditions in the second half of 2022. However, to illustrate the performance with an analogy, if the market were a car, it would now be traveling at a rate of 85 mph rather than 100 mph. Indeed, fundamentals remain exceptionally tight with a 2022 Q4 availability rate of 4.8%, only 20 basis points (bps) above the second-quarter historic low of 4.6% and 500 bps below the pre-COVID historical quarterly average of 9.8%. Further, availability improved by 40 bps on a year-over-year (YOY) basis. Net absorption totaled nearly 91 million square feet (msf) in the quarter, up slightly from 85 msf in 2022 Q3 but below the 133 msf average from 2020 Q4 through 2022 Q2. Of note, however, net absorption remains roughly double the pre-pandemic quarterly average. Meanwhile, new completions reached a record high of roughly 113 msf; this marked the second consecutive quarter with deliveries over 100 msf and only the third time deliveries broke the 100 msf mark with 2021 Q4 being the only other quarter to reach the lofty total.
INDUSTRIAL MARKET FUNDAMENTALS

Source: CBRE-EA, as of Q4 2022
Regionally, 43 of the 69 markets tracked by CBRE-EA reported availability of less than 5% in 2022 Q4. Honolulu reported the lowest availability rate in the nation at 3.1% and was followed by Allentown, Portland, Orange County, Las Vegas and Riverside, which all reported a 2022 Q4 availability rate of 3.2%. Meanwhile, Detroit, Fort Worth, Allentown, South Central PA, Milwaukee, Portland, Miami, Charlotte, Savannah and Dallas were among markets reporting record low availability. Availability in an additional 12 markets, including Houston, Orlando, Tampa, Washington, DC, Chicago and Northern New Jersey, was within 30 bps of the market’s historic low. Overall, the strength among markets is broad based, with many port/gateway, Midwest and growth markets ranking among the tightest in the nation and showing strong historic performance.
Given the strength that is still pervasive in the market, YOY rent growth remained in double-digit territory for the fourth consecutive quarter and accelerated to 13.8% nationally. There was a wide dispersion in performance with rent growth ranging from a low of only -0.6% in Westchester to a high of 35.4% in Los Angeles. The lower end of the rent growth spectrum was limited, however, with only eight markets reporting growth of less than 3%. On the higher end of the spectrum, 32 markets, or roughly one-third of all markets, reported a double-digit gain in rents.
Going forward, with demand moderating amidst growing uncertainty and a projected economic downturn, risks to the property outlook have increased. That said, the industrial market has never been better positioned headed into a downturn, with availability below 5% in two-thirds of markets and at or near record lows in roughly half of all markets. Demand may moderate further but should remain positive as companies continue to build inventories post-pandemic. Indeed, Green Street’s Warehouse Inventory Index remains 4% below pre-COVID levels, which were lean to begin with as many distributors were relying on just-in-time inventory management. The continued rebuilding of inventories and switch to just-in-case inventory management should support demand in the coming years.
Construction activity remains robust, however, with over 612 msf of space currently under construction; this equates to nearly 4% of inventory. In normal circumstances, this would amount to less than two years of supply as the net absorption rate has averaged 2.3% annually over the previous 10 years; that said, with a moderation in demand, this could extend to 3-4 years of new supply. This will likely temper rent growth; however, we expect rent growth to remain positive given the still low availability rates expected. On the downside, however, if rents do soften, the loss to lease nationally averages roughly 36% but generally ranges from 30%-74% among markets. This is more than ample to offset any softness and still yield healthy NOI growth, particularly as the average rent correction during the three previous recessions (early 90s, tech and GFC) was only 8%. Overall, the industrial market is poised for still solid performance in the coming years.
RENT PERFORMANCE
(SELECT MARKETS)

Source: CBRE-EA
Source: CBRE-EA, NCREIF and RCA, as of Q4 2022
Retail
Retail fundamentals continued to tighten in the fourth quarter of the year, with total availability dropping to a new record low of 4.9%. Availability is down 10 basis points (bps) quarter over quarter (QOQ) and 80 bps year over year (YOY). Net absorption totaled nearly 12.7 million square feet (msf) in the fourth quarter and nearly 81.4 msf for the year. Construction activity slowed further with less than 25 msf being completed on an annual basis; this was the lowest level of completions ever reported. Overall, total retail inventory increased a mere 0.3%. Further, over the previous decade, total retail stock has increased by only 7%; in comparison, industrial, apartment and office stock have increased by a respective 18%, 17% and 11%.
Fundamentals improved across all subtypes. Like the broader retail market, neighborhood and community shopping center (NCSC) availability declined to a record low of only 6.9%, down 20 bps QOQ and 110 bps YOY. Less than 5.5 msf of space was added to the market in the year, while demand was nearly seven times deliveries at roughly 37 msf. Lifestyle and mall (L&M) availability improved to 6.0%, down 20 bps QOQ and 90 bps YOY. Availability in the L&M segment of the market is now only 60 bps above the 2020 Q1 pre-COVID level of 5.6% and 100 bps above the quarterly long-term historical average since 2005. A mere 1.3 msf of new L&M space was added to the market, an increase of inventory of only 0.2%, well below the historical average annual increase of 1.1%. Further, the increase in stock has remained below 1.0% since 2017. Meanwhile, power center fundamentals declined to 5.3%, 10 bps and 110 bps improvement from 2022 Q3 and 2021 Q4, respectively. Development edged up slightly in 2022 with 1.6 msf added to the market, up from 1.2 msf and 1.4 msf in 2021 and 2022, but was a mere fraction of the average completions of 4.9 msf from 2010 to 2020. Net absorption stood at 8.6 msf, just shy of the 9.0 msf absorbed in 2021.
Overall, while retail fundamentals have improved considerably across all property subtypes, rent growth performance has varied. NCSC rent growth has accelerated steadily over the previous year and a half, increasing from a YOY-pace of only 1.3% in early 2021 to 3.0% in 2022 Q4. Notably, this is the first time rent growth has reached 3.0% since mid-2017 and the EA Asking Rent is now at a record high of $22.06 per square foot. Rent growth for PC and L&M was more tepid. PC rents advanced 1.2% YOY in the fourth quarter, a deceleration in growth from 2.3% in 2022 Q3 and 2.5% in 2021 Q4; however, PC rents too are at a record high, reaching $25.51 per square foot in the quarter. Meanwhile L&M rent growth was modestly positive at 0.4% but the EA Asking Rent remains down 1.8% from its pre-COVID high of $34.34 in 2019 Q1.
The stabilization of demand and the lack of new supply has positioned the market well for any potential economic slowdown. Indeed, rising interest rates, more persistent inflation and the overall economic uncertainty today are increasing trepidation among consumers, and this is flowing through into retail sales performance and the consumer outlook. With respect to retail sales, the holiday shopping season was a disappointment with November and December retail sales declining 1.0% and 1.1% on a monthly basis; sales in both months were short of expectations. The softening in sales was broad based with furniture stores, electronics and appliance stores, department stores, miscellaneous store retailers, and nonstore retailers reporting monthly declines of 1% or greater. At the same time, consumer sentiment improved in December; however, the University of Michigan Index of Consumer Sentiment remains close to a record low. Overall, sentiment is below where it started in 2022, below its trough in 2020 when the COVID-19 pandemic was at its worst, and consistent with levels seen during historically severe recessions. Consumer balance sheets are also a concern with delinquency and default rates rising across the consumer finance market, where the total dollar delinquency rate is 50 bps higher than it was pre-COVID. Going forward, with layoff announcement picking up, weak sentiment and softer balance sheets, spending growth is expected to moderate further. Again, we believe the retail property sector is well positioned to withstand the pending softness. Demand for space may moderate; however, the lack of supply underway should allow fundamentals to remain relatively healthy and allow for continued modest rent growth.
CONSUMER CONFIDENCE LEVELS CONSISTENT WITH PREVIOUS RECESSIONS

Sources: University of Michigan, NBER
CONSUMER INSTALLMENT PERFORMANCE WORSE TODAY RELATIVE TO EARLY 2020
(TOTAL DELIQUENCY RATE, % OF OUTSTANDING BALANCES)

Sources: CreditForecast.com, Moody’s Analytics
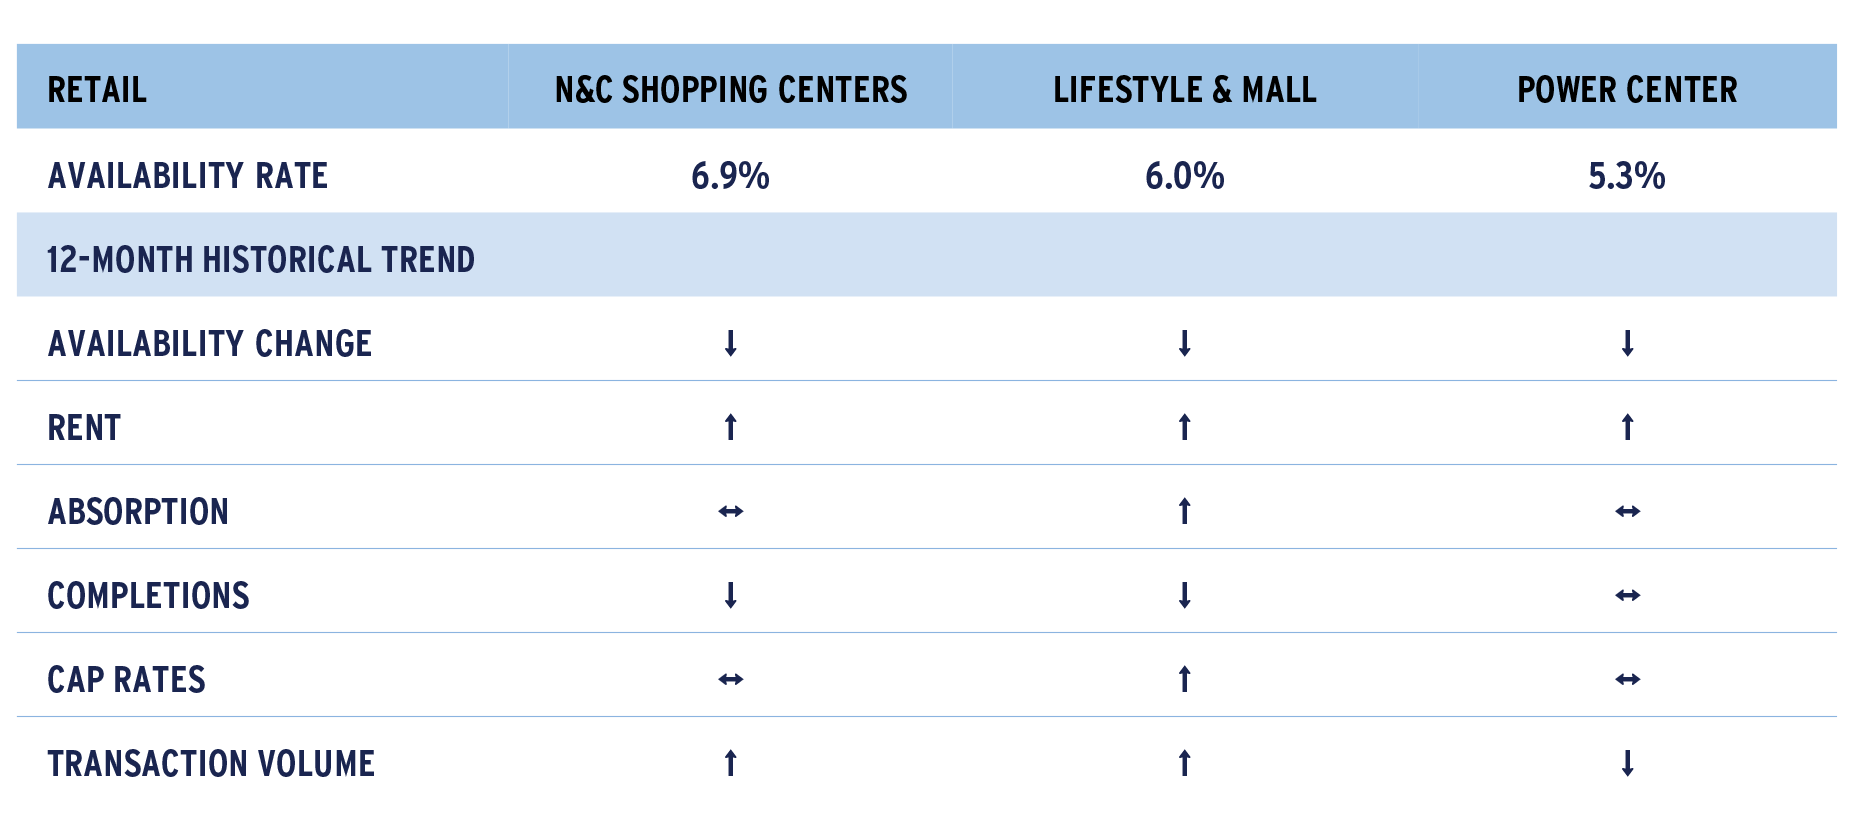
Source: CBRE-EA, NCREIF and RCA, as of Q4 2022
This material is intended for information purposes only and does not constitute investment advice or a recommendation. The information and opinions contained in the material have been compiled or arrived at based upon information obtained from sources believed to be reliable, but we do not guarantee its accuracy, completeness or fairness. Opinions expressed reflect prevailing market conditions and are subject to change. Neither this material, nor any of its contents, may be used for any purpose without the consent and knowledge of AEW. There is no assurance that any prediction, projection or forecast will be realized.