WHERE WILL THE CYCLE TURN FIRST?
In late April 2024, global focus on the potential escalation of the conflict in the Middle East increased. Despite fears of energy prices rising, inflation has continued to decrease rapidly. Although the UK and Germany are in technical recession, a Europe-wide recession has been avoided. Bond and stock markets have started to price in multiple rate cuts. Downward valuation adjustments continued in the second half of 2023, with offices recording the largest declines. The excess spread of prime property yields over long-term government bond yields is recovering and coming very close to its 25-year historical average. This should encourage more multi-asset investors to return to a more proactive commercial real estate investment stand. The key question for our mid-year 2024 European Outlook is “As market repricing is coming to an end, where can investors best position themselves to benefit from the upcoming recovery?”

AFTER STRONGEST REPRICING, PRIME OFFICES SHOW BEST PROJECTED RETURNS
- With inflation falling to near-target levels over the last six months, central banks are widely expected to begin reversing some of their rate hikes in H2 2024. Even as some of Europe’s largest economies are in technical recession, our modest GDP growth projections have remained mostly unchanged. Our 20-country average government bond yield is forecast to decline to 2.9% by 2028 from 3.5% at year-end 2023. However, this is still 40 bps higher than in our Sep-23 projections for 2028.
- Eurozone real estate borrowing costs are expected to peak in Q1 2024 at 4.5% and stabilise at 4.25% by mid 2025, given the high historical correlation between government bond yields and 5-year swap rates. This will make debt accretive again for some higher yielding investments.
- Our latest base case forecast shows a small downgrade for prime rental growth at 2.1% p.a. for 2024-28 from 2.2% in September 2023. At 2.5% p.a., logistics and residential keep their top spots while INREV data on vacancy rates confirms that offices face a tougher challenge than other sectors in that respect. Bifurcation between prime and secondary offices also continues, driven by occupier requirements for higher quality space.
- The latest quarterly IPE Real Assets Expectations Indicator survey on expected capital values over the next year confirms that sentiment has steadily improved since Q4 2022 across all sectors, with the notable exception of offices. Sentiment benefited from excess spread of property over bond yields improving over previous quarters.
- Full year 2023 European transaction volumes came in at €150bn, just over a half of the 2022 full year volumes as bid-ask spreads persisted between sellers and buyers. Volumes have been impacted by capital value declines, which are projected at 28% and 16% in the current cycle, for offices and non-office sectors, respectively.
- Based on the lower projected bond yields, prime yields are forecasted to move in by an unchanged 20 to 65 bps across all property sectors over the next five years. However, this tightening is from a higher level than before as yields widened more in H2 2023 than previously expected, especially for offices.
- Prime offices are now projected to have the highest returns of any sector at 9.6% p.a. over the next five years. Contrary to prevailing sentiment, this is due to the larger than previously expected repricing in 2023 and Q1 2024. Logistics come close in second place with 9.5% p.a.. Across all 196 covered sectors, projected 2024-28 returns were modestly lower at 8.8% p.a. from 9.2% p.a. in Sep-23 in our base case scenario.
- Our latest estimate for the European debt funding gap (DFG) across all sectors and 20 countries comes in at €99bn, up from €90bn in our 2024 Outlook. Office-backed and Germany-based loans show the biggest DFG in 2024. The increase is mostly due to larger than expected capital value declines in H2 2023. Overall, 17% of all 2018-21 loan originations are expected to face a relative DFG in Europe, largely unchanged.
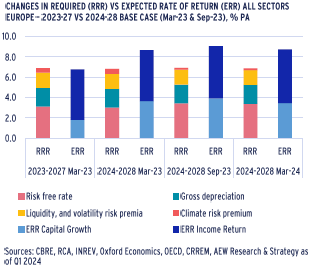
- With over 93% of our 168 covered European markets classified as neutral (55) or attractive (101) could provide a clear signal for investors to restart their investment activities. Based on our updated forecasts, our relative value assessment implies a slightly lower than expected rate of return at 8.7% p.a. (ERR) and an unchanged 6.9% p.a. required rate of return (RRR). This gives an average 185 bps positive excess across our 168 markets coverage.
ECONOMIC BACKDROP – NEAR-TARGET INFLATION EXPECTED TO BRING RATES DOWN
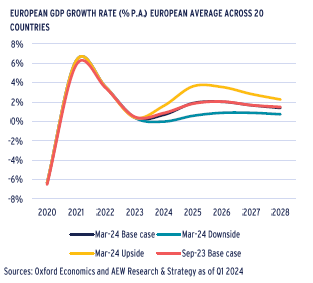
DESPITE TECHNICAL RECESSIONS, GDP GROWTH REMAINS ON TRACK
- Oxford Economics forecasts European GDP to grow by 0.9% in 2024, a similar projection to their Sep-23 view.
- Both Germany and the UK, two of Europe’s leading economies, entered into technical recession after posting marginal negative GDP growth in Q3 and Q4 2023.
- Germany is projected to post marginally negative GDP growth for 2024. Economic growth for the UK and France are projected at 0.5% in 2024, well below the 20-country average.
- This modest growth can be explained by the restrictive monetary policies which have now reduced inflation.
- Our downside scenario reflects lower GDP growth that could be a result of an unexpected increase in inflation forcing central banks to keep rates high.
- Our upside scenario assumes that GDP grows faster as inflation drops below central banks’ target levels,
- Given recent stabilisation, we feel that the probability of our base case scenario is slightly higher than over the last 2-3 years.
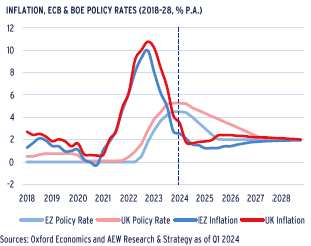
NEAR-TARGET INFLATION EXPECTED TO PUSH POLICY RATES DOWN
- Headline inflation in the Eurozone (EZ) fell further than widely expected to 2.4% y/y in Mar-24 with the UK data showing a similar but delayed pattern with Feb-24 inflation at 3.4% y/y.
- Oxford Economics (OE) projects EZ and UK inflation to decline by the end of 2024 to 1.9% and 2.2%, respectively – very close to the central banks’ target inflation rate of 2.0%.
- Assuming inflation stabilises around the target, OE forecasts ECB and BoE policy rates to come down. ECB rates are projected to settle at 2.0% before year-end 2025 followed by BoE rates by year-end 2027.
- Geopolitical uncertainties remain and could impact on growth and inflation. To reflect these possible future outcomes, our downside scenario assumes lower economic growth and higher inflation while our upside scenario assumes the opposite.
- Investors pricing 10-year government bonds typically follow these anticipated declines in central bank policy rates.
GOVERNMENT BOND YIELDS PROJECTED TO COME BACK IN
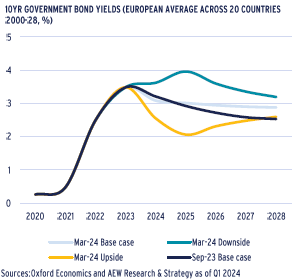
- Average 10-year government bond yields across our 20 European countries are expected to have already peaked at 3.5% as of year-end 2023.
- This is not a shockingly high level and is in fact close to the 3.4% pre-pandemic 20-year average.
- Going forward, OE’s latest forecasts show that government bond yields are expected to gradually decline to 2.9% by 2028. This is 40 bps above their Sep-23 projection for 2028 at 2.5%.
- Given that inflation is projected to stabilise at 2% p.a., this is an unexpected result, which we will address separately below.
In our downside scenario, government bond yields are expected to peak at 4.0% bps in 2025. In the upside scenario, the peak is assumed to have been realised at 3.5% at year-end 2023. - Given the high historical correlation between government bond yields and 5-year swap rates, there are repercussions for real estate investors’ costs of borrowing.
- Based on this, we now expect EZ borrowing costs to peak in Q1 2024 at just above 4.5% and stabilise at 4.25% by mid 2025, up from 3.5% in our previous 2024 outlook in Nov-23.
ECONOMIC BACKDROP – STICKY PROPERTY YIELDS LIKELY TO COME BACK IN
HIGHER NEUTRAL RATE PROJECTION EDGES UP 2028 BOND YIELDS
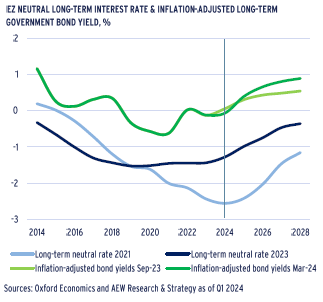
- To explain the surprising 40 bps increase in OE’s projection for year-end 2028 bond yields, we need to consider their long-term projections for the neutral interest rate across the Eurozone.
- The neutral rate is an estimated rate where long term supply and demand for capital are in equilibrium on an inflation adjusted basis.
- This theoretical rate is useful as it affects a sustainable level of policy rates and also impacts the long-term pricing trends of government bond yields.
- Drivers for neutral rates include factors that alter the aggregate supply and demand of capital, such as demographic trends, productivity, levels of quantitative easing or tightening, government borrowing, net foreign assets and other.
- OE’s latest estimated neutral rate for 2028 has increased by over 80 bps from their 2021 estimate. This has triggered the increase in the projections of government bond yield by year-end 2028.
- The largest contributor to this change is the change in the assumptions on quantitative tightening, while the demographic trends are still the main reason rates to remain negative.
LIMITED SENSITIVITY TO HIGHER BOND YIELDS IN CURRENT CYCLE
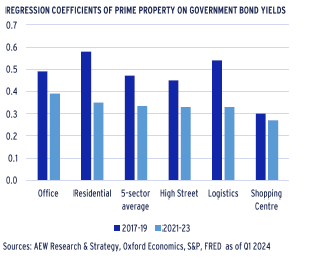
- Government bond yield forecasts are one of the main macro factors that directly influences our property yield projections. But this impact might not be stable over time.
- To check whether property yields react in the same way in rising or declining markets, we show sensitivities when the average bond yields were trending up (2021-23) versus a similar 3-year period when they were trending down (2017-19).
- On average, across the five sectors, 100bps rise in government bond yields would correspond to 33bps rise in 2021-23 property yields vs. 47bps compression for every 100bps compression in the bond yields in the 2017-19 period.
- This means that property yields have been stickier when government yields moved out (2021-23) compared to when they compressed (2017-19).
- Differences between sectors show a higher sensitivity for office and residential yields and lower for higher-yielding shopping centres.
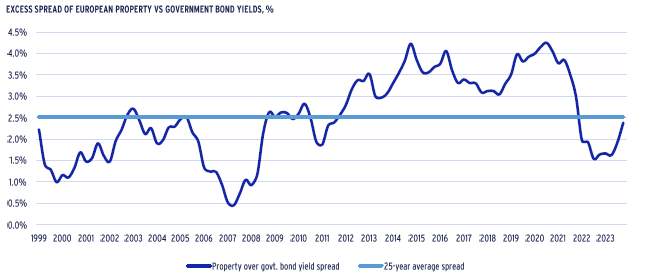
EXCESS PROPERTY YIELD SPREAD STARTING TO IMPROVE AGAIN
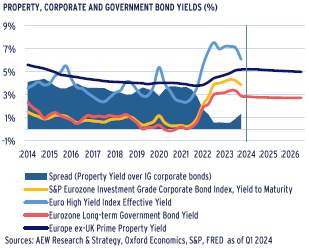
- Income oriented investors will likely consider yields for property relative to both government and high yield (HY) as well as investment grade (IG) corporate bonds.
- When we consider the data in the chart for Q1 2024, property yields widened by 10bps q/q, while bond yields tightened by between 30 bps to 100 bps depending on the index used.
- The excess spread of property over government and IG corporate bonds increased to 230bps and 130 bps, respectively.
- HY corporate bonds yields are 90bps higher than property yields.
- Despite this recent improvement investors might not be able to return to the excess spreads seen in the 2014-21 period.
- The yield-only comparison has a limited scope, as real estate has a proven track record of providing capital value appreciation.
- Bond investors are unlikely to realise consistent capital appreciation, especially if they hold bonds to maturity.
MARKET OVERVIEW – LOGISTICS & OFFICES: SENTIMENT TYPICALLY OVERSHOOTS
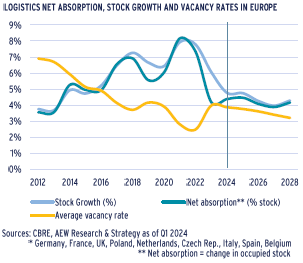
LOGISTICS VACANCY TO COME DOWN FROM 2023 LEVEL OF 4%
- Logistics take-up in 2023 reverted to lower pre-covid levels, at around 20 million sqm after high levels of 25 million sqm take-up activity in 2021 and 2022 across Continental Europe.
- The 2021-22 levels were driven by the surge of e-commerce activity during the pandemic.
- New supply responded to the high demand and in 2023, speculative development increased its share of space under construction, representing nearly 50% of developments.
- With this combination of increasing supply and slightly lower demand, the average European logistics vacancy rate increased to 4% in 2023 up from 2.5% in 2022.
- However, many logistics developers struggled with profitability in 2022-23 as construction, labour and financing costs all went up while logistics capital values came down.
- With new supply coming back in, the vacancy rate is projected to come down gradually to 3.2% by 2028 as net absorption is expected to balance the more limited level of future completions.
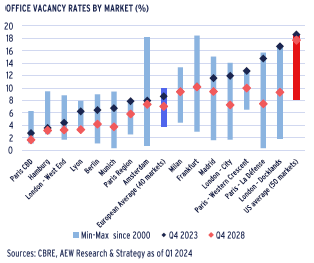
OFFICE VACANCY RATES EXPECTED TO ALSO COME DOWN IN EUROPE
- As a result of the development of remote working, office demand has decreased post-Covid. Occupiers are renting smaller and higher quality spaces and consolidating into fewer but centrally located offices.
- The European average office vacancy rate remains reasonable at 9% on average across 40 European markets.
- While it represents a 285bps increase compared to pre-Covid levels, it remains in line with the historic average since 2000 (8%).
- It also offers a sharp contrast to the 19% US average vacancy rate.
- Bifurcation of the European office market has increased post-Covid. This is illustrated by higher vacancy rates in peripheral submarkets, like London Docklands and Paris La Défense.
- Central and accessible submarkets show much lower vacancy rates, such as London West End (4.4%) and Paris CBD (2.5%).
- Going forward, we expect vacancy rates to come down by 160 bps on average over the next five years. Even for the exceptions (Milan & Frankfurt) we expect vacancy rates to remain stable.
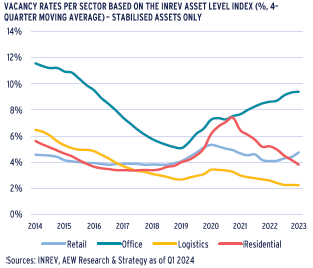
INVESTORS HAVE SEEN OFFICE VACANCY INCREASED THE MOST
- Vacancy rates across European property sectors, some of which are not available from brokers, can be tracked with the INREV Asset Level Index (ALI) data as it shows performance of institutional investors’ real estate portfolios since 2014.
- At 9%, offices show the highest ALI vacancy rate after excluding assets under (re-)development. Offices shows the largest and most enduring vacancy increase since the Covid pandemic.
- Pre-Covid office vacancy was at 5% at the end of 2019 while it is worth noting that office vacancy was near 12% back in 2014.
- The vacancy rate in the retail sector appears low but this mostly reflects the high degree of selectivity of institutional investors.
- Residential vacancy is currently low at less than 4% but recorded a sharp increase during Covid lockdowns as tenants moved out.
- The logistics vacancy rate is the lowest across our sectors at 2.4% after steadily decreasing since the start of the Index in 2014.
MARKET OVERVIEW – HIGHEST RENTAL GROWTH FOR LOGISTICS & RESIDENTIAL
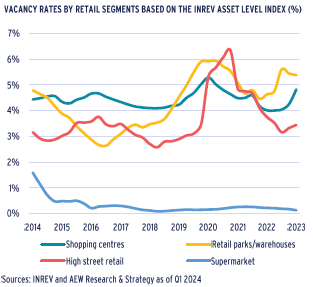
INSTITUTIONAL QUALITY RETAIL SUB-SECTORS HAVE LOW VACANCY
- Over the past decade, the retail sector has suffered from lower retailers’ space demand triggered by online shopping and more recently by inflation-driven reduced consumers’ purchasing power.
- Despite these challenges, the INREV Asset Level Index (ALI) data (which covers just over 1,000 assets) shows that vacancy rates across retail sub-sectors, were between 3% and 6%.
- Since 2014, reported vacancy rates were relatively low and stable – except for the 2020-21 Covid period.
- These low levels of vacancy might not be fully reflecting the conditions of the overall retail market, since the ALI covers high quality institutional assets.
- The differences in vacancy between shopping centres, retail parks and high street retail are surprisingly low, while supermarkets benefit from close to 100% occupancy, as expected.
- Based on the ALI data, the spike in the vacancy rate in high street retail to over 6% during Covid was short-lived.
LOWER SUPPLY OF NEW RESI AS DEVELOPERS’ PROFITABILITY SUFFERS
- Despite a recent softening of construction costs, residential developers continue to struggle with a high cost of capital and lower sales prices making new developments less profitable.
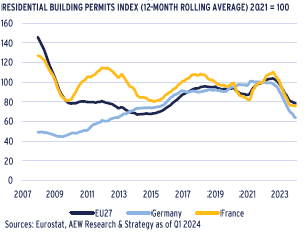
- As a result, the supply pipelines of new housing in the main European markets are shrinking. The number of residential building permits filed in the EU27 – a leading indicator of future developments – fell sharply in 2023.
- These permits might not even translate into new residential developments as many developers are facing financial difficulties, particularly in Germany where the market is more fragmented.
- Given the underlying drivers remain in place, new supply is unlikely to recover in the short term. This will likely lead to supply in constrained cities being even tighter, pushing up market rents further.
LIMITED SUPPLY & MODEST GROWTH LIFTS PRIME RENTS
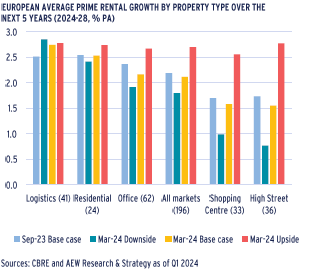
- Our latest base case forecast for prime rental growth comes in at 2.1% p.a. for 2024-28. This is a modest downgrade from 2.2% in our September 2023 base case.
- Logistics and residential keep their top spots in our latest prime rental growth outlook, both with an average of above 2.5% p.a.
- Prime rental growth across all sectors ranges between a solid 1.8% and 2.7% p.a. for our three current macro scenarios.
- Both shopping centres and high street retail are expected to have below average 2024-28 annual rental growth of 1. 6% p.a.
- In particular for offices, it is important to note that our forecasts focus on prime rents only. Rents for many secondary quality assets are under pressure and unlikely to see growth.
- Many expanding occupiers prefer modern space in energy efficient buildings. At the same time, investors are also increasingly aware of the weak or negative rental growth outlook expected for many non-prime assets.
MARKET OUTLOOK – REVIVAL AROUND THE CORNER, MIGHT STILL FEEL TOO EARLY
2023 DEAL VOLUMES HALVED AS BID-ASK SPREADS PERSIST
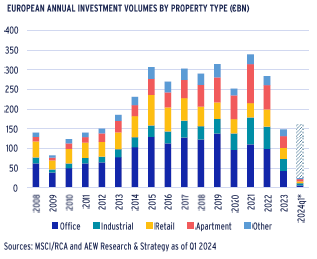
- Full year 2023 transaction volumes across the main property types came in at €150bn, just over half of the 2022 full year volumes and ahead of our Nov-23 estimate of €140bn.
- For full year 2024 we estimate €160bn in investment volumes, as indicated in the graph.
- Bid-ask spreads remain high, especially for offices despite repricing having been steeper and faster than expected.
- Many transactions proceed at lower prices than most sellers’ original reserve prices, as lenders push for refinancings, and fund investors seek redemptions.
- Given that 2023 was a relatively good year for stocks and bonds compared to property, we expect a reversal of the denominator effect as real estate has sunk to below investors’ targets.
- This could trigger investors to increase their investments and re-start their acquisitions to meet these target allocations.
PRIME YIELDS TO TIGHTEN AFTER MID-YEAR 2024
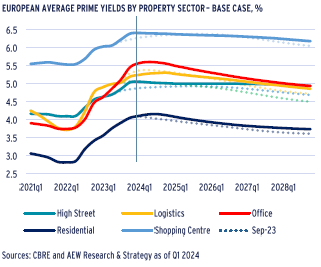
- Higher interest and swap rates pushed prime property yields up more and for longer than initially anticipated.
- Prime office yields are projected to widen the most of any sector by 180 bps on average by mid-year 2024, followed closely by logistics and residential at 150 bps and 140 bps, respectively.
- Prime shopping centre yields are projected to widen a bit in 2024 for a cumulative widening of 200 bps since 2018 with prime high street retail expecting a 160bps yield expansion by mid-2024.
- On the back of this expected repricing up to mid-year 2024 and our base case projection for lower government bond yields, we now project prime yields to move in by 20 to 65 bps across all sectors over the next five years.
- In fact, prime office yields are forecast to tighten by 65 bps over the next five years from mid-year 2024, followed again by logistics and residential at just below and above 40 bps, respectively.
- It should be noted that yield tightening for prime offices reflects investor preference and is unlikely to translate into lower yields for non-prime offices.
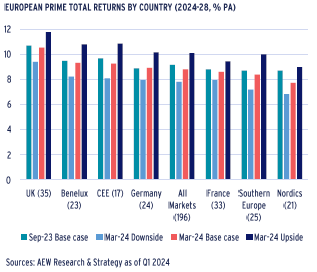
UK STAYS ON TOP IN PROJECTED TOTAL RETURN RANKINGS
- As mentioned above, the average total return across all markets is projected at 8.8% p.a. for the 2024-28 period for our base case.
- Again, UK markets are projected to deliver the highest average total return of 10.5% p.a., which is driven by higher current yields and stronger forecasted yield compression compared to other countries.
- Benelux markets are ranked second with a forecast return of 9.3% p.a., driven by a strong forecasted yield compression.
- Despite relatively strong rental growth forecasts, Southern European markets are projected to have modest average yield compressions, causing them to lag behind, albeit with a solid return of 8.4% p.a.
- CEE markets rank in third place in our total return projections partly driven by a higher number of logistics markets and higher rental growth compared to other countries.
- Both Germany and France are close to the European average prime return projections. Our returns are based on CBRE prime data and not valuations, which might be delayed somewhat.
- As investors are still facing downward value adjustments, it might feel too early for many to accept a revival is coming shortly.
MARKET OUTLOOK – PRIME OFFICES RANK TOP DESPITE POOR INVESTOR SENTIMENT
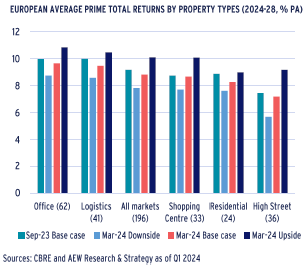
OFFICE IS SURPISE TOP RANKED SECTOR IN OUR RETURN PROJECTIONS
- Our prime returns projections moved down across all sectors to 8.8% p.a. for the 2024-28 period compared to 9.2% p.a. for the same years in our base case from Sep-23.
- Surprisingly, prime office markets are now projected to have the highest returns of any sector at 9.6% p.a. over the next five years. This is due to their bigger than previously expected repricing to mid-year 2024 and continued solid projected rental growth.
- Prime logistics markets come in second place with returns of 9.5% p.a. on the back of their less significant repricing, current yields and rental growth projections.
- Given the elevated level of geopolitical uncertainty, we should consider that our latest downside scenario shows returns at 7.8% p.a. on average across sectors while our upside scenario indicates 10.1%.
- Two factors drive our projections. Firstly, the prevailing negative sentiment pushed office yields up more than expected. Second, projected yield tightening by year-end 2028 has been cut back given the latest bond yield projections.
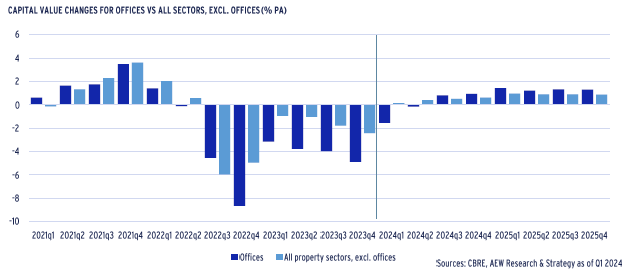
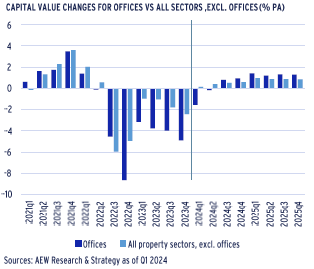
STRONGER REVIVAL EXPECTED FOR OFFICES AFTER SHARP REPRICING
- Our strong projected office returns can be contextualised by a comparison of capital returns versus all other sectors over the last three years and the new two years.
- Cumulative capital value declines for offices vs non-office sectors in the current cycle are projected to be 28% and 16%, respectively.
- These sectoral differences are a departure from patterns seen post-GFC even if the first year of value adjustments are followed by a modest correction in the second year – except for offices.
- Many investors are still absorbing ongoing valuation declines and might feel that it is too early for capital values to rebound in 2024.
- Cycles have turned in the past and it would be reasonable for us to expect the same again now, even for offices.
- Our latest base case projections indicate a mildly stronger capital value recovery for offices for H2 2024 and 2025.
- Precisely timing the cycle might still prove challenging as bid-ask spreads remain large and investor sentiment remains negative on offices in particular.
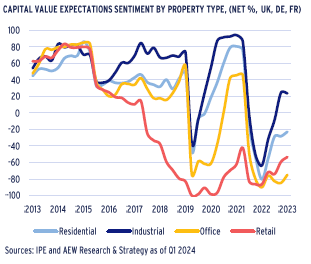
OFFICE TRAILS BEHIND AS OVERALL MANAGERS' SENTIMENT IMPROVES
- As a reflection of manager sentiment, we present the historical results of the quarterly IPE Real Assets Expectations Indicator survey in which we have ourselves participated since 2018.
- The net percentage (%) shown is calculated as the difference between the share of real estate managers who believe property values would increase vs decrease over the next 12 months.
- Based on this, a value of 0 would indicate a neutral sentiment on the sector’s performance over the next 12 months.
- The data confirms the negative impact from the Covid lockdowns in early 2020 and subsequent recovery, as well as the impact of the rate hikes after Q1 2022.
- Investor sentiment across all major sectors has steadily improved since Q4 2022, with the notable exception of offices – which trails behind
DEBT FUNDING GAP – REFINANCINGS CREATE CHALLENGES & OPPORTUNITIES
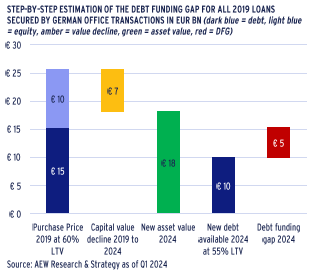
LARGEST DEBT FUNDING GAP OF 2024 FOR GERMAN OFFICES
- Our step-by-step methodology for the debt funding gap (DFG) is illustrated for 2019 originated loans secured by German offices:
- 1.Transaction volumes are adjusted for non-levered deals.
- 2.Assumed average LTV of 60% at purchase 2019
- 3.Actual and projected value decline for German offices shows a -29% between 2019 and 2024.
- 4.New debt volume is estimated at 55% LTV of new value.
- 5.Additional equity (or junior debt) is needed to avoid loan default, we highlight this in red as the debt funding gap.
- The unusually large 2019 volume of transactions in German offices, lower refinance LTVs and negative capital value growth result in a DFG of €5.3 bn for this sector in 2024.
- In fact, the 2019 German office loans trigger the largest single country-sector in our 2024 DFG.
- Not included in the example here, but we have assumed that any loans with DFG maturing in 2023 are extended into 2024 and 2025.
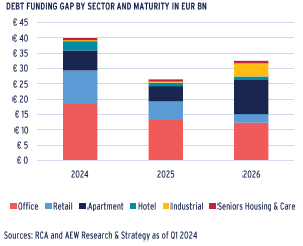
BIGGEST DFG CHALLENGES WITH OFFICE-BACKED LOANS
- Based on our latest capital value data and forecasts, our European DFG across all sectors and 20 countries comes in at €98.9bn, up from €90.3bn in our Nov-23 outlook.
- This increase in our overall DFG is due to higher-than-expected capital value declines in H2 2023 and our new capital growth projections.
- Based on new market feedback we have also finetuned our assumption on allocating the 2018 loan vintage DFG equally to 2024 and 2025.
- Office-backed loans account for 45% of our new DFG, followed by apartments at 23% and retail with 20% of the total.
- The high office proportion in the overall DFG is mostly due to larger historical office transaction volumes and wider relative yield widening in offices when compared to other sectors.
- As before, we also note the decrease in our estimated 2025 DFG corresponding to the Covid-impacted 2020 origination vintage.
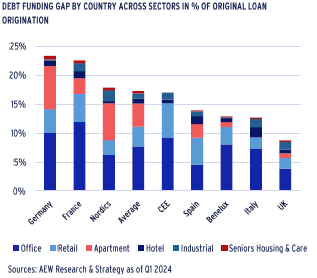
GERMANY POSES BIGGEST CHALLENGE IN % OF LOAN ORIGINATIONS
- Placing the absolute DFG in a useful relative context is done by taking each country’s DFG as a share of its originated loan volumes.
- The average share across our full 20 European countries coverage stands at 17%, up from 16% in our Nov-23 analyses.
- This 17% pan-European relative DFG indicates that one-sixth of originated loan volumes cannot refinance when the loans fall due in the next three years.
- The €37bn DFG for German real estate-backed loans represents 23% of all loan originations from the 2018-21 period.
- Germany has the highest relative DFG among the 20 countries covered and is closely followed by France.
- Consistent with previous analyses, the UK’s relative DFG stands at only 9% and could be due to the BoE’s post-GFC slotting rules forcing more conservative lending by UK banks.
- This should allow lenders for UK collateral to resolve these issues sooner and for the property market to rebound ahead of other European markets.
RELATIVE VALUE ANALYSIS - MOST EUROPEAN MARKETS ATTRACTIVE
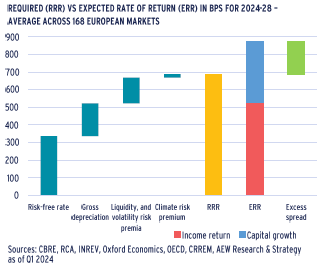
185 BPS OF RELVAL EXCESS SPREAD FOR 2024-28
- Our risk-adjusted return approach is based on a comparison of the required rate of return (RRR) and the expected rate of return (ERR) over the next five years.
- For the 168 European markets shown, average RRR is projected at 6.9% p.a., while our ERR for 2024-28 is estimated at 8.7% p.a..
- This means that the ERR has a significant positive excess spread of 185 bps over the RRR.
- Our risk-free rate of 3.4% remains the largest component of the RRR and has come down marginally since Sep-23, reflecting the recent stabilisation in government bond yields.
- Based on this, we believe that investors will be well compensated for the risks they take across European real estate markets over the next five years.
- Separately, our analysis allows us to classify each individual market as attractive, neutral or less attractive by comparing its ERR and RRR.
SLIGHTLY LOWER ERR LEAVES RELVAL MOSTLY UNCHANGED
- Our positive relative value outlook for 2024-28 is consistent with our Sep-23 analysis from our 2024 annual outlook.
- With the cumulative repricing now absorbed for both the full years 2022 and 2023, there are very few changes. This is partly due to the fact that the RRR has come down by a marginal 5 bps.
- Our ERR for 2024-28 is projected to decline from 9.1% p.a. in Sep-23 to 8.7% in our Mar-24 base case due to a 50 bps decrease in capital growth compared to our Sep-23 base case.
- On the other hand, the income component in the ERR has improved marginally, partly offsetting the lower capital value increase.
- Our excess spread came down from 200 bps in Sep-23 to 185 bps in our current Mar-24 estimate.
- Our latest results show consistency with our 2024 annual outlook but slightly fewer markets as classified as attractive for new acquisition in 2024.
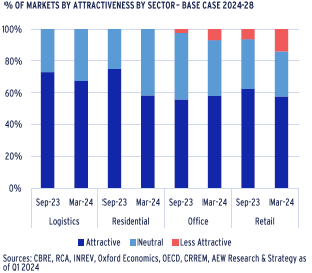
LOGISTICS STILL TOP SECTOR WITH MOST MARKETS ATTRACTIVE
- In our Mar-24 base case scenario, investors should meet or exceed the RRR in over 93% of markets, slightly down from 97% in our Sep-23 base case.
- Of the 168 markets covered, 101 are classified as attractive (down from 109), 55 markets as neutral (up from 54), and only 12 as less attractive (up from 5), highlighting the limited change in classifications.
- Logistics remains our top RelVal sector, with more than twice the number of markets classified as attractive (25) vs neutral (12) and none in the less attractive category.
- Residential is the runner-up in our RelVal ranking, with 14 markets classified as attractive vs 10 neutral with no market in the less attractive category.
- Only 7% of the markets covered remain classified as less attractive making it relatively easier to source attractive individual deals, especially for managers that have new capital to deploy.
RELATIVE VALUE ANALYSIS - SOLID ACROSS THE BOARD
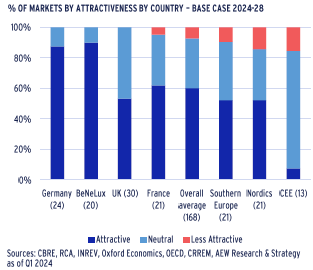
GERMANY RETAINS TOP COUNTRY RANKING FOR RELATIVE VALUE
- Based on our Mar-24 projections, investors should meet or exceed the RRR in over 93% of markets, down from 97% in Sep-23.
- Germany retains our top relative value country pick based on this measure, as it has 21 attractive markets and only 3 neutral market – up slightly from just 1 neutral market in Sep-23.
- The UK, on the other hand, has fallen behind mostly due to its higher RRR as UK bond yields are still expected to stay higher.
- Benelux and France show more attractive markets than the European average while Southern Europe, Nordics and CEE continue to trail the European average.
- Only 7% of our markets remain classified as less attractive.
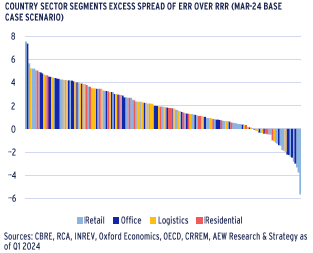
CAREFUL MARKET SELECTION KEY WITH -6% TO +8% SPREAD RANGE
- Sector and country specific classifications do hide market specific results, which might be useful to consider.
- In our latest analyses, we find a wide range from minus 600 bps to a positive 800 bps excess spread across our 168 market segments.
- Given that the average excess spread is nearly 200 bps, this means that some markets show excess spreads at near 4 times, while others are showing -3 times the European average.
- This wide range of individual markets’ excess spreads highlight the need for an experienced manager’s ability for careful selection of sub-markets (and individual deals) at this point in the cycle.
- Many offices and retail markets are still coming up with negative spreads, where we recommend extra care.
- When we reaggregate the submarkets on a country and property type we can rank them by segment across the core European countries.
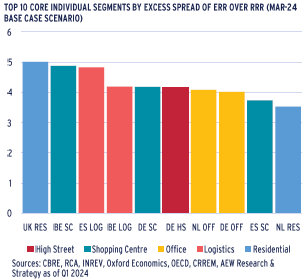
ALL SECTORS IN TOP TEN EXCESS SPREAD CORE SEGMENT RANKING
- Surprisingly, in our RelVal excess spread (bps of ERR > RRR) rankings include some core retail markets, like prime Belgian, German and Spanish shopping centres as well as German high street retail.
- UK residential ranks top in our core segment ranking, with Dutch residential closing out the top 10.
- In respect to logistics, prime Spanish and Belgian markets show strong rankings in terms of excess spread.
- Top ranked office markets in this respect are Dutch and German markets with excess spreads of 400 bps – well above double the European average of 185 bps.
- Germany is the most featured country in our excess spread ranking with three sectors followed by Belgium, Spain and Netherlands with two sectors each.
This material is intended for information purposes only and does not constitute investment advice or a recommendation. The information and opinions contained in the material have been compiled or arrived at based upon information obtained from sources believed to be reliable, but we do not guarantee its accuracy, completeness or fairness. Opinions expressed reflect prevailing market conditions and are subject to change. Neither this material, nor any of its contents, may be used for any purpose without the consent and knowledge of AEW. There is no assurance that any prediction, projection or forecast will be realized.