AVERAGE QUALITY RETURNS NOT CONSISTENLY HIGHER THAN PRIME
- This report presents our initial analysis of the difference between traditional prime and average quality property returns, as many investors have questioned the representativeness of broker-led prime returns as they might not reflect the average quality of properties available in the market.
- To answer this, we use return data for 20 countries across 4 property sectors from the core INREV asset level index data. This new data represents a major step forward in European market transparency as it reports performance of a large representative property portfolio assumed at average institutional quality.
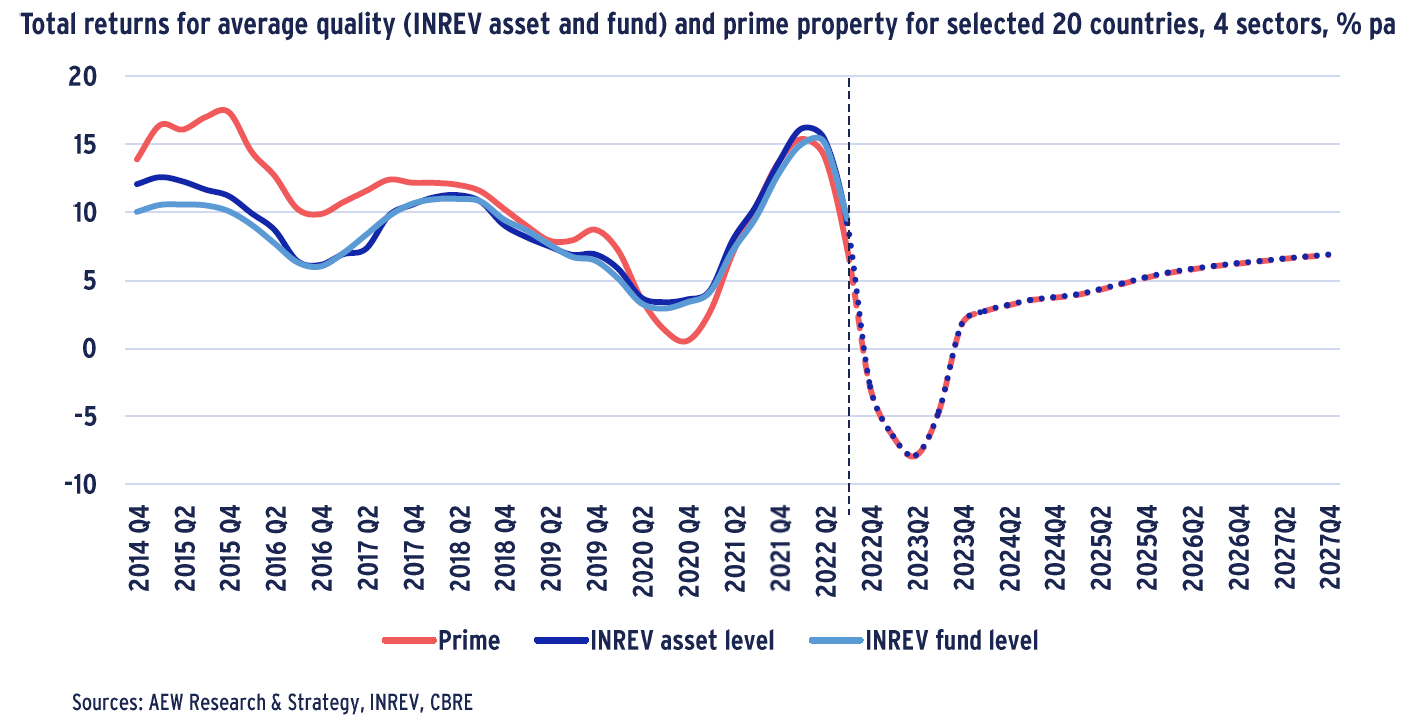
- To compare the difference between average quality and prime returns, we estimate income returns and capital growth for our selected markets from the core INREV asset level universe data versus our own reweighted prime returns. Our chart clearly shows that these average quality and prime returns have been slowly converging and are now highly correlated.
- In launching our new forecasts for average quality (INREV asset level) returns, we map them to our existing prime return forecasts. High and increasing correlation of historical returns warrants interpolation of the last 5-years of historical differences between the two returns series into our new forecast.
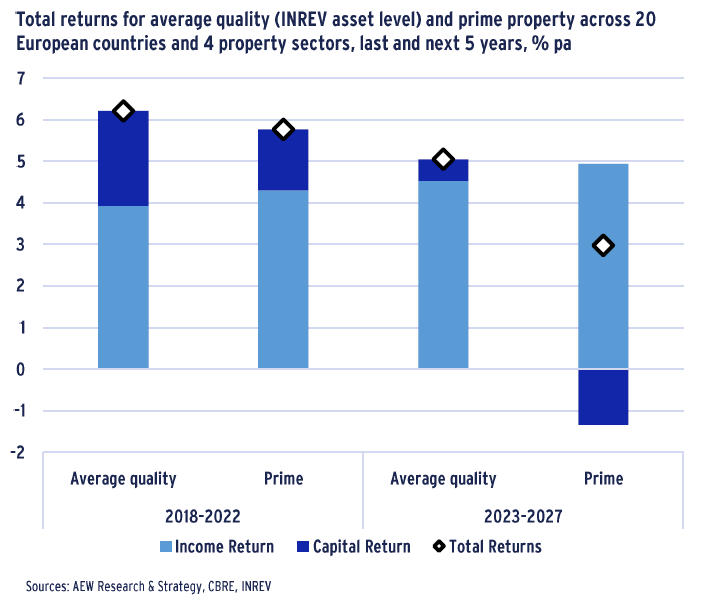
- Despite the convergence in returns, our initial comparison still confirms the consensus that prime returns are lower than average quality property returns on average. This holds for the last five years, as well as to a much lesser extent for the next five years.
- However, when we look more closely at country specific differences between average quality and prime returns, the former are not consistently higher than prime as the overall averages in the chart suggest.
- Sector-specific total returns across the 20 countries present mixed evidence. Only residential and retail prime show lower returns than average quality properties. In contrast, prime logistics and offices have higher total returns than average quality properties in these sectors.
AVERAGE QUALITY RETURN FORECAST BEATS PRIME
- Many investors have questioned the validity of prime returns as they might not reflect the average quality of properties available in the market.
- The INREV asset level core index data allows a step forward in European market transparency as it reflects reported portfolio performance.
- Aside from INREV’s published indices, the underlying allows us to select return data for 20 countries˚ and 4 property types for our analysis.
- To test the difference between average quality and prime returns, we compare income and capital returns for the INREV asset level universe (assumed at average quality) vs our own reweighted prime returns.
- To allow a forward looking comparison, we map for the first time our existing prime forecast to the average quality (INREV asset level) returns.
- Our initial comparison confirms the consensus that prime returns are lower than average quality property returns. This holds for the last five years, as well as for the next five years.
- However, contrary to general consensus prime returns are more volatile than average quality property returns. This is mostly driven by capital returns.
- We explain differences in return calculations later in the report.
LESS CONSISTENCY FOR SOME MAJOR COUNTRIES
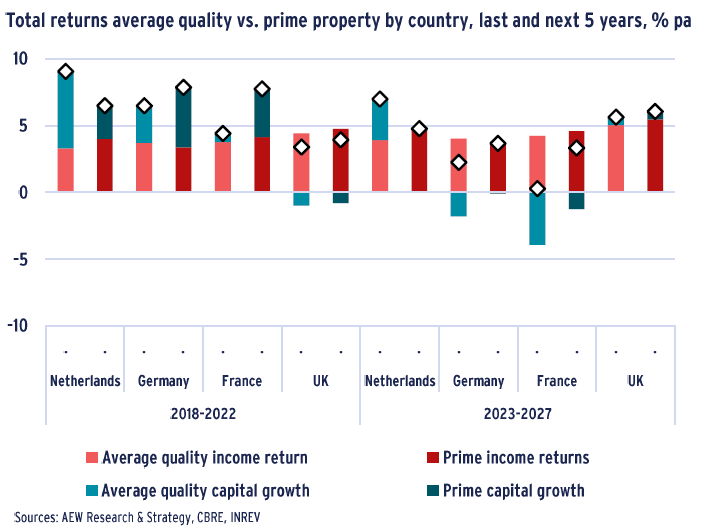
- Considering our overall returns in more detail we focus on individual countries. The average quality return data from our selected INREV’s asset level index markets has solid data coverage for the four largest European countries.
- Unfortunately, country-level differences between average quality and prime returns are less consistent than the overall averages shown above.
- In contrast to the 20-country average, both historical and projected prime returns exceed average quality returns in Germany, France, and the UK.
- It should be noted that income returns between prime and average quality are more similar than capital returns.
- Inconsistencies in capital returns between prime and average quality properties can be explained by several factors:
–Less data availability on a country level
–Sensitivity to the timing of capital returns
–Volatility in sector weights on a country level - The negative French historical average quality capital growth returns might require further investigation for the impact of data limitations.
UK SHOWS HIGHEST PRIME VS AVERAGE QUALITY CORRELATION
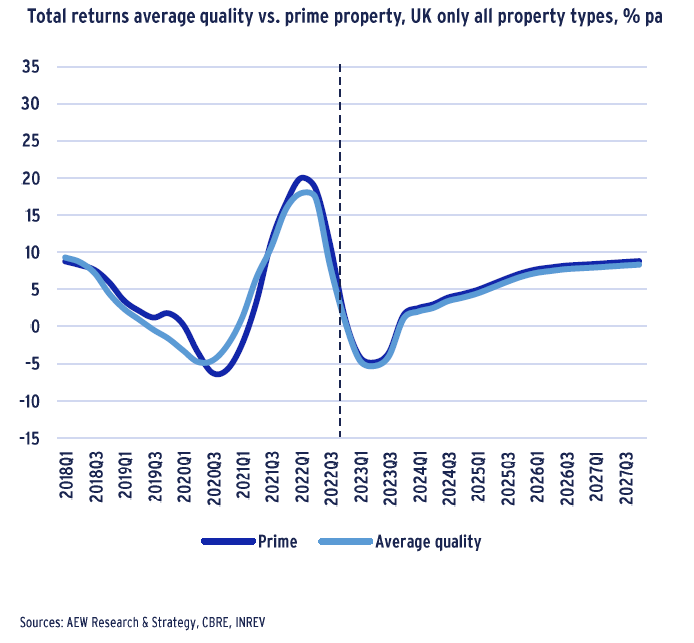
- Our line chart shows the full extent of the historical volatility over time and the high correlation between prime and average quality property returns for the UK.
- UK returns have recovered post-pandemic from the low point recorded in Q4 2020 to peak just before the invasion of Ukraine in Q1 2022.
- In terms of our forecasts for the average quality property returns, we assume a stable correlation with our prime returns.
- This means that our forecast for average quality property across the UK for all sectors is 4.3% pa compared to our prime return of 4.7% pa for the next five years.
- The increase of interest rates over the last four quarters has already begun negatively impacting both returns, which we project to stabilize and show modest growth after Q2 2023.
- A detailed analysis of the correlation between the two different return series over time for all four countries confirms that our above five-year averages cannot fully reflect any timing and delays patterns.
- However, this consistency is particularly strong for the UK (as shown in the chart) due to the well-diversified and stable distribution of return data across all four property sectors.
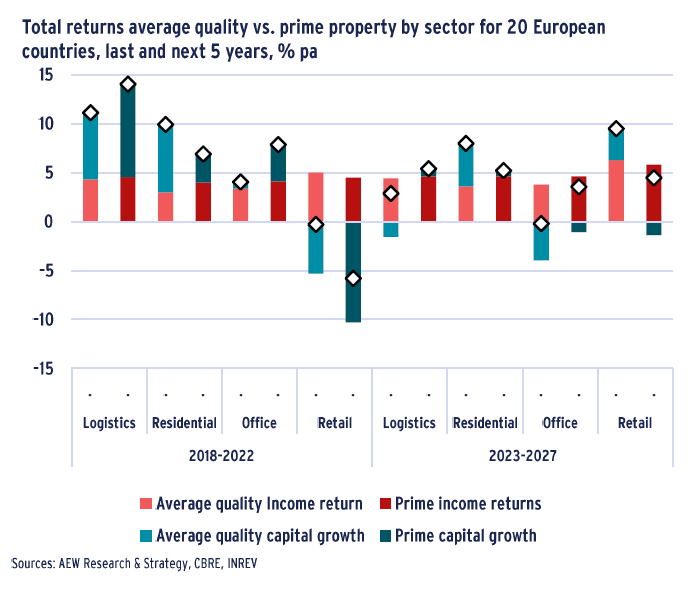
MIXED EVIDENCE ACROSS THE PROPERTY SECTORS
- On total returns by sector across the 20 countries the evidence is mixed.
- Only residential and retail prime show lower returns than average quality properties. In contrast, prime logistics (incl. industrial) and offices have better total returns.
- Contrary to what most would expect, prime income returns are higher than average quality income returns for all sectors, except retail.
- For logistics and offices, prime returns were higher in the past due to higher capital growth, while for residential and retail this was reversed.
- Historical differences are extrapolated into the forecast, where negative capital growth is expected for average quality logistics and office, while on the prime side, there is negative capital growth for office and retail.
- Income returns are expected to grow in both the prime and average quality properties, as initial yields are forecasted to widen out further.
- These sector results, similar to our previous country-specific results, are affected by data availability, sensitivity to the timing of capital returns, and volatility in country weights in every sector.
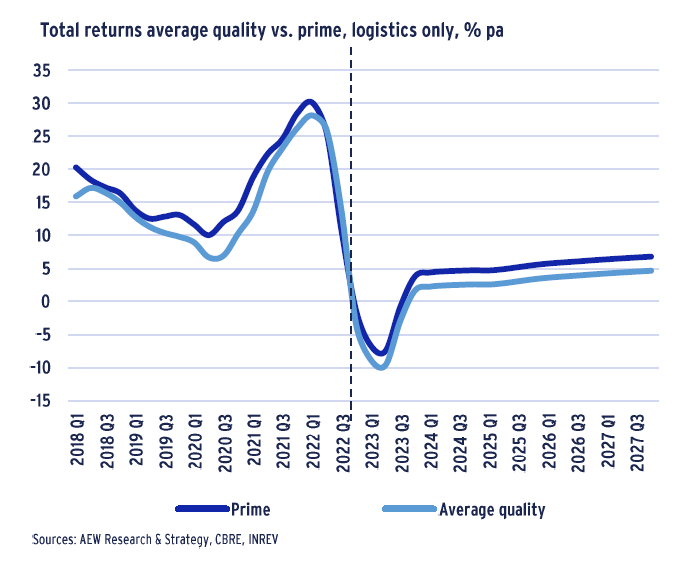
PRIME RETURNS AHEAD OF AVERAGE QUALITY LOGISTICS
- Our logistics chart shows a high level of correlation between our prime returns and the average quality returns. The latter is slightly more inclined to drop during market lows.
- Over most of the period, prime logistics returns are exceeding average quality returns. This might be due to new developments pushing up prime returns while making existing properties redundant more quickly.
- The declining difference between average quality and prime returns might confirm the increasing maturity of the sector but also highlights the sensitivity of low yielding sectors to increases in interest rates.
- Logistics has shown the highest return across property types, as showed both resilience and accelerated growth during the Covid lockdowns.
- High returns attracted more investors to the sector, who needed to get exposure if they were underweight before. This enhanced the liquidity in this particular sector.
- As with other sectors, a correction is underway due to higher interest rates and the increasing maturity of logistics as a sector in the last decade.
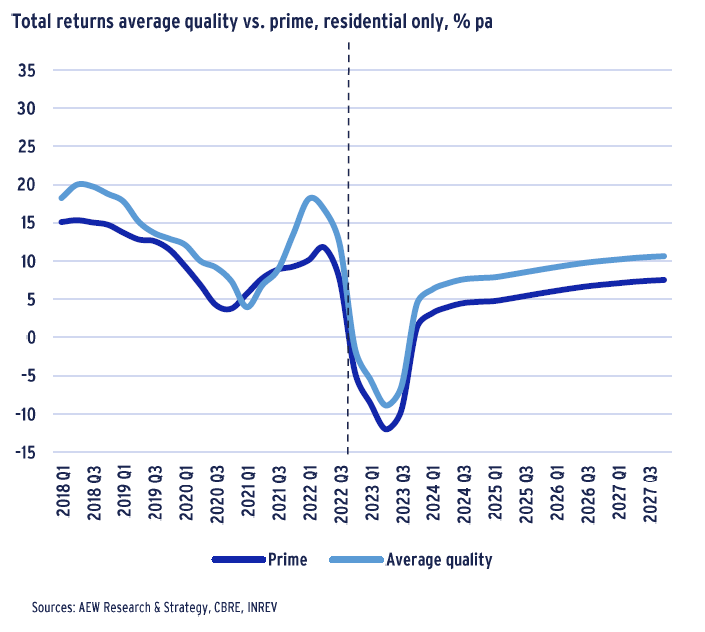
HIGHER RETURNS FOR AVERAGE QUALITY RESIDENTIAL
- Unlike most other sectors, residential has a higher average quality property return in comparison to prime returns.
- Correlation between both returns is more volatile over time in this particular sector.
- Furthermore, average quality returns are consistently better than prime regardless of their point in the cycle.
- This is explained by rent cap regulations limiting income growth on prime properties more so than average quality properties.
- Other explanatory factors are the limited amount of new development activity, the early stage of institutionalization of the residential sector in some countries as investors increasingly recognize it as a good diversifier.
- Our projections show negative returns after interest rates steadily increased over the last year, impacting developers and institutional investors.
- In addition, mortgage rates will dampen home development and buying as households struggle with higher interest rates, inflation and the related cost of living crisis.
- In turn, this will force home price increases to moderate while more people will keep renting, making rental housing a defensive play. This leads to a stabilization of returns after 2023 Q2.
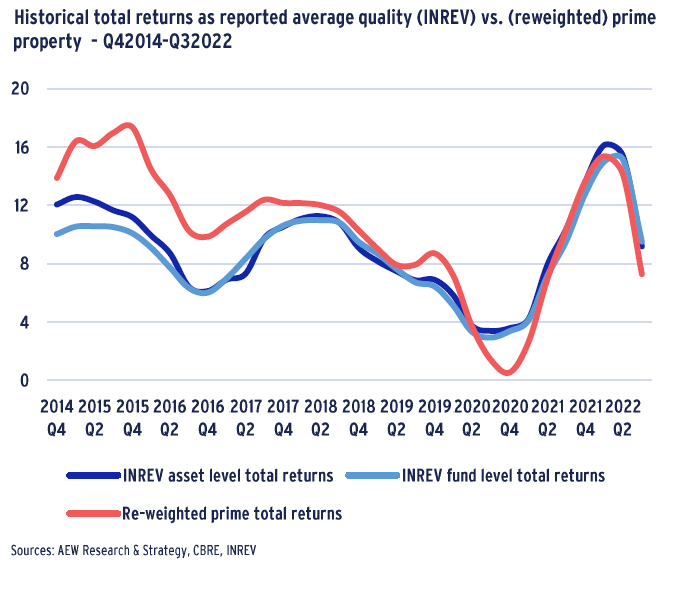
METHODOLOGY: HISTORICAL CORRELATION IN TOTAL RETURNS
- Historical INREV asset level total returns are highly correlated to the INREV fund level total returns in the period from Q1 2015 to Q3 2022.
- Our reweighted prime total returns are estimated using published CBRE prime yield and rental growth data, applying INREV asset level index sector and country weights, which are described below.
- In contrast to the broker-led prime returns, INREV asset-level returns are valuation-based returns from actual portfolios of reporting INREV members.
- These reweighted prime total returns are themselves also highly correlated with both asset-level and fund-level returns.
- Prime returns are also more volatile relative to both INREV returns, showing outperformance prior to the pandemic.
- Over the last five years there is no consistent outperformance of prime property over average quality property returns.
- This is a reversal from the 2015 to 2018 period when we saw an average outperformance of reweighted prime over asset returns of nearly 400bps pa.
PRIME RETURNS BASED ON INREV SECTOR-LEVEL COMPOSITION
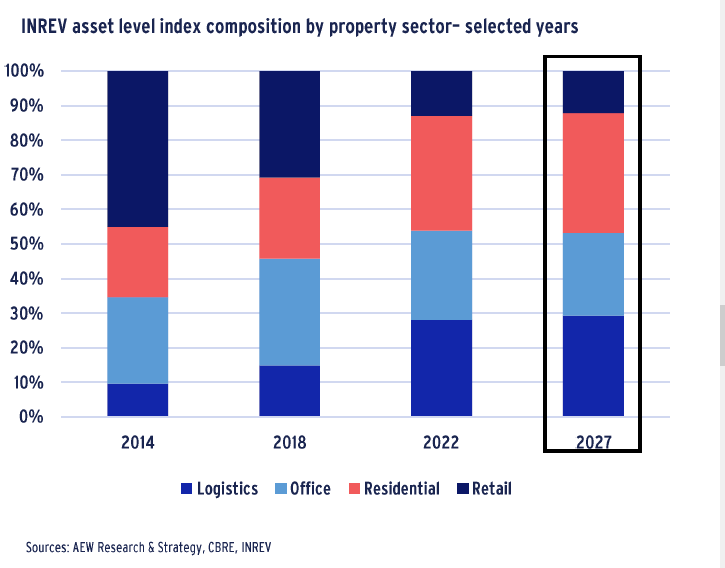
- To map our existing prime returns to average quality property returns, we assume the same country and sector level composition as that of our selected 20 countries and 4 sectors from the INREV asset level index data as shown in the chart for 2014, 2018, and 2022.
- To achieve that we match and aggregate as closely as possible our nearly 200 prime city property type segments to the geographic and property type makeup of the underlying data from the INREV asset level index.
- We use historical actual weights to estimate historical returns and use our prime capital value forecast to come up with future weights after 2022.
- Logistics nearly tripled from around 10% in 2014 to 28% in 2022.
- Residential’s share went up by more than half from 20% in 2014 to 33% in 2022, while retail sector decreased from 45% to 13%.
- Changes in the office sectors’ share were less dramatic.
- Based on our prime capital value forecast the shares of the property sectors remain relatively stable post-2022.
RECENT DATA CONFIRMS HIGH CORRELATION
- The scatter chart confirms the historically high correlation between reported average quality and prime property returns for our selected markets.
- Our data includes 236 pairs of annual returns for each of the four countries: the UK, France, Germany, and the Netherlands; and for each of the four sectors: retail, office, residential, and logistic.
- When going into the country and sector-specific returns, we do lose some observations due to confidentiality and INREV’s data policy.
- This data availability has not posed a significant hurdle for our analyses across our 20 countries and 4 sectors which represent core Europe.
- For the most recent 160 (red) observations, the R squared of the non-linear regression stands high at 0.77, which leads us to exclude the green pre-2018 observations from the test.
- This supports our interpolation of reweighted prime into average quality property return forecasts as it explains 77% of the variation in the average quality property returns, given equal weights of the countries and sectors.
This material is intended for information purposes only and does not constitute investment advice or a recommendation. The information and opinions contained in the material have been compiled or arrived at based upon information obtained from sources believed to be reliable, but we do not guarantee its accuracy, completeness or fairness. Opinions expressed reflect prevailing market conditions and are subject to change. Neither this material, nor any of its contents, may be used for any purpose without the consent and knowledge of AEW. There is no assurance that any prediction, projection or forecast will be realized.
