- Bond yields and swap rates stabilised over the last year. Even as inflation has broadly settled, European central banks are now more cautious on further rate cuts due to increasing tariffs and other geopolitical uncertainties.
- As European capital values started stabilising since early 2025, many investors now ask whether the remaining refinancing challenge has sufficiently eased for market liquidity to return to more normal levels.
- To answer this question, we update both our European debt markets overview as well as our debt funding gap estimate.
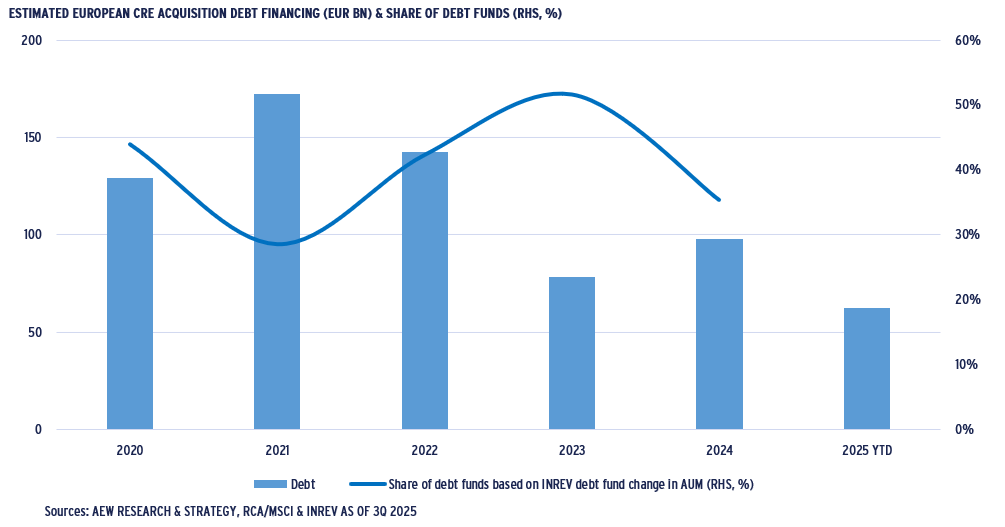
- As the European market has been finding solutions to the refinancing challenges, private debt funds have become a significant force in the European markets, with a 30-50% share of annual origination.
- Transparency on private debt funds remains limited. Recent innovations, such as back-leverage from investment banks and others, are expected to further increase debt funds’ returns and ability to raise further capital from investors.
- Banks themselves are also innovating and create more balance sheet capacity through significant risk transfers (SRT) by selling their first-loss CRE loan positions to hedge funds and others to lower their regulatory risk capital requirements.
- Our update provides transparency where possible, since these new innovations make it more difficult for bank regulators and others to assess the systemic risk in an increasingly private CRE debt market.
REFINANCING CHALLENGE REMAINS FOR OFFICE AND FRENCH COLLATERAL
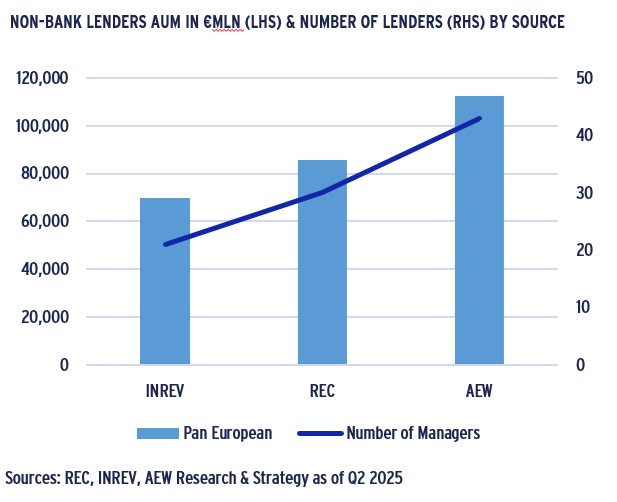
- As European transaction volumes recovered in 2024-25, acquisition-related debt origination was estimated at €98bn, a 26% increase from its 2023 low. Debt funds are gaining market share from traditionally dominant banks, as illustrated by 43 non-bank lenders estimated to have €110bn in European CRE debt AUM as of mid-year 2025.
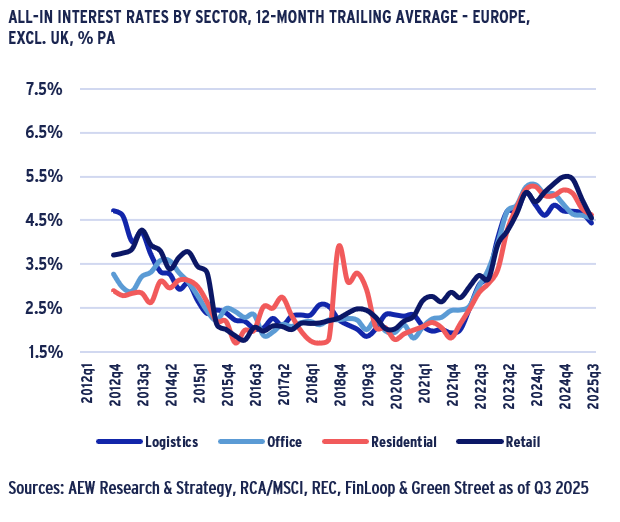
- Over the last year, all-in borrowing costs have broadly stabilized at accretive levels below prime yields. This is especially true in the Eurozone and to a lesser extent for the UK. Swap rates (and government bond yields ) in the UK remain elevated. UK loan margins have tightened in line with Eurozone loan margins – even for offices.
- Our loan database confirms the recent trends of higher LTVs and lower all-in rates, consistent with improved confidence. It further shows rates tightening for lower LTV loans and surprisingly for loans backed by French collateral. UK and German rates were stable over the last year as the highest and lowest in Europe, respectively.
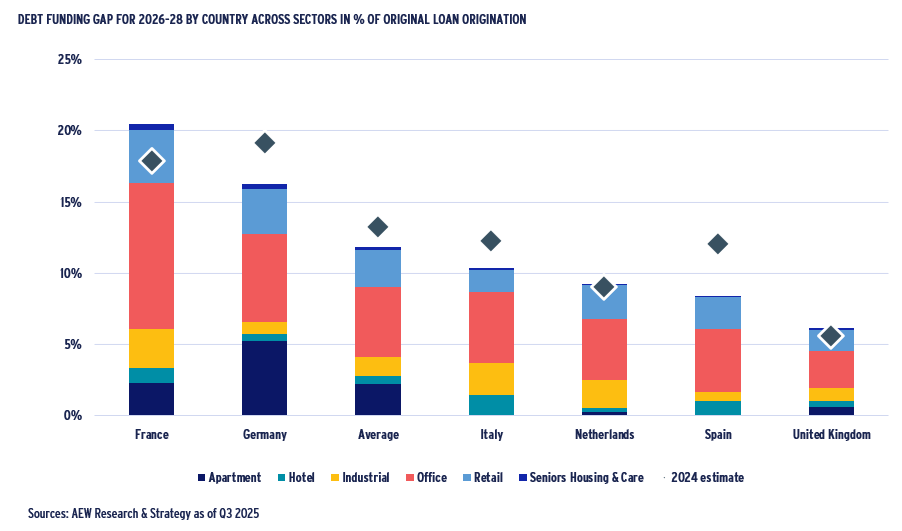
- The remaining refinancing challenges borrowers face have eased. Our estimate for the European debt funding gap (DFG) for the next three years is €74bn – an 18% reduction from 2023. This easing is further confirmed by a reduction of the Europe-wide relative DFG (as share of past loan originations) from 13% in 2024 to 12% for 2026-28.
- France moves against this overall improving trend and at 20% faces the biggest challenge compared to 2024. In line with other countries, Germany’s relative DFG has reduced to 16% from 19% in 2024. Office-backed loans account for 41% of the DFG, followed by retail loans at 21%, residential at 19% and others at 18%.
- Debt-on-debt has become a widely used collaborative structure to bridge the DFG, with outstanding back leverage estimated at near €30bn. Despite being part of the short-term solution, it is unclear how the growth of less regulated debt funds and debt-on-debt providers might affect Europe’s long term financial markets’ risk.
- Average defaults and losses across Europe have also improved. Our updated estimate for defaults show 5.8% of loans expected to default -- down from 7.1% in last year’s estimate. Associated losses are projected at 1.6%, a reduction from last year’s estimate of 1.8%. This should allow lenders to reduce their potential loss provisions.
- On a country level, French loans are estimated to have worsened with a 4.2% loss, more than double the European average and up from 2% last year. This is due to a more pessimistic outlook on French capital values, particularly for logistics and offices, compared to last year’s projections.
- Across European property sectors, the position has remained more stable with estimated losses for retail-backed loans near 5% down from 6% but still triple the European average.
CURRENT EUROPEAN CRE MARKET TRENDS
2025 AVERAGE ACQUISITION LTV EDGES UP TO 50%
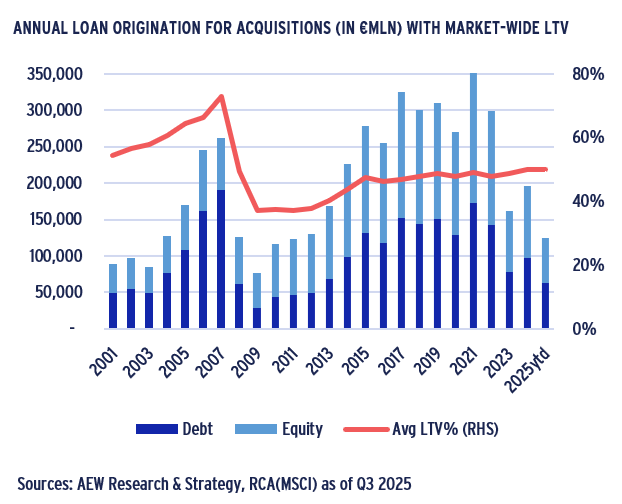
- Based on our latest data and estimates, debt financing used to fund new acquisitions reduced by 44% from 2021 (with a post–GFC record of €172bn) to €97bn in 2024.
- This was due to higher all-in interest rates, which made debt no longer accretive, reducing overall transaction volumes.
- Transaction volumes in 2024 recovered from 2023 after most investors absorbed capital value declines.
- As a result, the amount of acquisition-related debt volumes increased by 26% in 2024 from 2023. We expect a further increase based on higher deal volumes for the full year 2025.
- Year-to-date 2025 acquisition loan-to-values (LTVs) have edged up to 50% but should still prove less challenging to refinancing than the record 2007 pre-GFC 73% LTV.
- Exact data on the share of banks and non-banks in the European debt market has been difficult to obtain.
- Banks have traditionally dominated, but debt funds have increased their activities and market share as shown before.
NON-BANK LENDERS PLAY BIGGER ROLE THAN CURRENT DATA IMPLIES
- INREV data on debt funds globally can be supplemented with Real Estate Capital’s Top 30 debt funds additional data on capital raised for European real estate lending.
- Based on a line-by-line comparison of (debt) fund managers and insurers we consolidate both sources and estimate their debt-related assets under management (AUM).
- Our estimate shows 43 different non-bank lenders with over €110bn in European CRE debt AUM as of mid-year 2025.
- However, we note that there are likely other sources of debt capital, such as family offices and pension funds which are not (yet) included in this estimate.
- Based on discussions with market participants we know that some of these investors are able to do (re-)development financings which many banks are unable to do.
- Many banks have been focused on re-financing legacy loans via back-leverage and reducing their CRE loan risk exposure via significant (synthetic) risk transfer (SRT) trades.
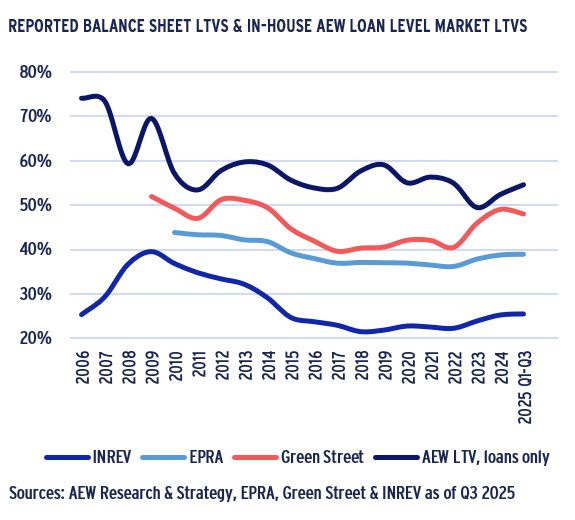
LATEST LTVS ACROSS REITS, FUNDS & LOANS EDGING BACK UP
- As presented previously, lenders’ risk appetite is expressed in loan-to-value (LTV) ratios as well as loan pricing.
- The latest data shows a slight increase in REITs’ balance sheet LTVs and in INREV’s private real estate fund LTVs confirming a persistent gap in the last 10 years.
- 2025 YTD average INREV LTV of 25% compares to the Q2 2025 EPRA and Green Street LTV of 39% and 48%, confirming the elevated leverage in the public markets.
- In contrast to our Sep-24 report, Green Street data shows a stronger downward trend for REIT LTVs than the EPRA data.
- Our in-house loan-level LTV market data shows an increase in Q3 2025 to 55% after a decline in 2024 to 50%. However, our loan level data disregards non-leveraged transactions.
- This increase in LTV is reflective of improved confidence from both lenders and borrowers that capital values for underlying collateral have bottomed out.
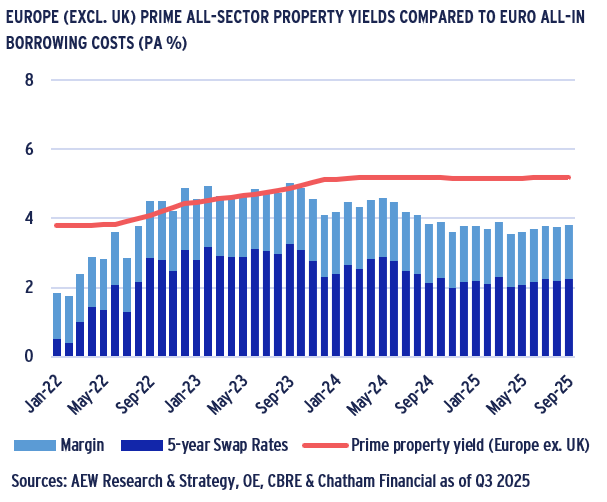
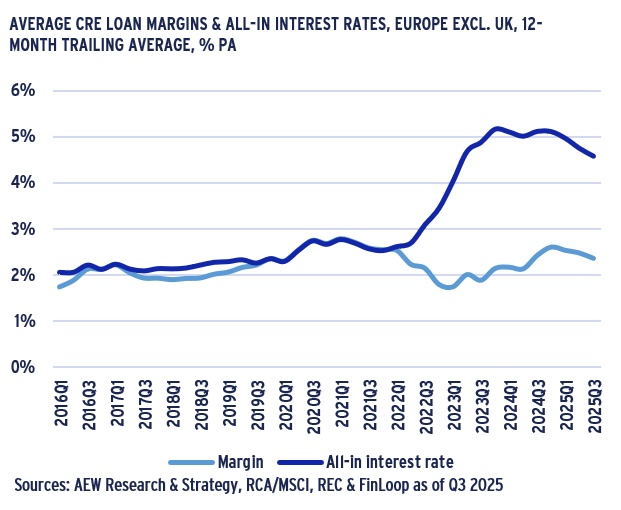
EUROZONE DEBT COSTS HAVE STABILIZED AND REMAIN ACCRETIVE
- Based on the latest data, Eurozone 5-year swap rates have tightened to 2.2% pa from 2.8% over the last four quarters.
- Loan margins have also tightened a bit from 170 bps to 160 bps pa since Jun-24.
- As a result, CRE all-in borrowing costs of 3.8% pa as of Jun-25 have come down from 4.5% pa over the last four quarters and from 5.1% pa in Sep-23.
- Cross-sector prime yields in the Eurozone as of mid-year 2025 are estimated at 5.2% pa, unchanged from Jun-24.
- This recent yield stabilisation still reflect a significant increase from 3.8% pa prime yields in May-22, which was before the inflation and rate hikes took effect.
- Based on this, CRE debt has remained accretive to the equity as prime yields of 5.2% pa are 140 bps ahead of all-in borrowing costs of 3.8% pa.
- Even if not as accretive as in late 2021, transaction volumes have started to positively respond to stable borrowing costs.
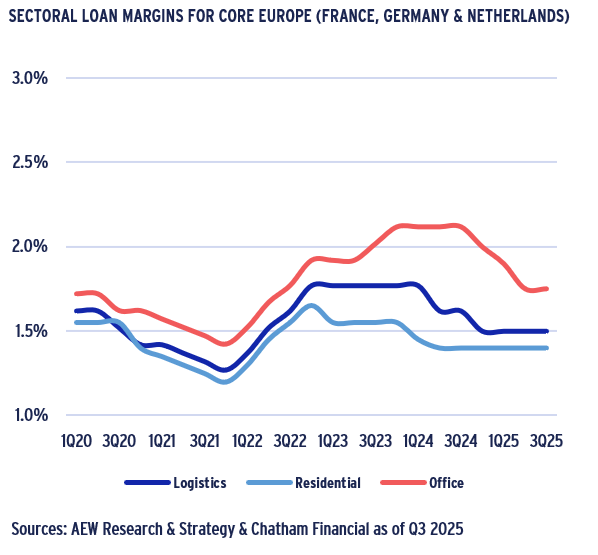
LOAN MARGINS FOR OFFICES MOVE DOWN IN LINE WITH OTHER SECTORS
- As of Q3 2025 loan margins for Northern Europe stand at 175bps, 150bps, and 140bps for the office, logistics, and residential sectors, respectively.
- Since Q3 2024, office loan margins tightened by over 35 bps, much more than any other sector.
- Chatham Financial’s data is based on loan origination records sourced from its debt and hedging advisory business for senior loans with LTVs at around 50%.
- After the initial Q1 2020 Covid shock, margins settled back down to their pre-Covid Q4 2019 in 2020-21.
- However, CRE margins surpassed their Covid peaks for most of 2023 on overall credit and specific office concerns.
- Only as inflation returned to normal in 2024 did logistics and residential loan margins return to below Covid peaks.
- With some delay, office margins are now tightening in as many companies are asking staff to return to the office and vacancy rates are peaking as new supply comes down.
- However, the data reflects only prime offices at prime locations and is not reflective of overall market.
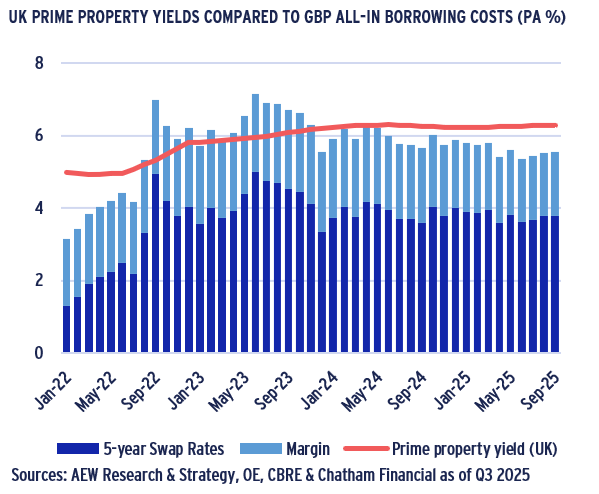
UK DEBT COSTS TRENDING DOWN TO BECOME MORE ACCRETIVE
- UK SONIA 5-year swap rates have tightened to 3.6% pa from 3.9% over the last four quarters. Loan margins have also tightened from 205 bps to 175 bps pa since Jun-24.
- As a result, UK CRE all-in borrowing costs of 5.4% pa as of Jun-25 have come down from 5.95% pa over the last four quarters and from 7.15% pa in Jun-23.
- Cross-sector prime yields in the UK as of mid-year 2025 are estimated at 6.3% pa, unchanged from Jun-24.
- This recent yield stabilisation still reflect a significant increase from 4.95% pa prime yields in Jun-22.
- UK CRE debt has become accretive as prime yields of 6.3% pa are 90 bps ahead of 5.4% pa borrowing costs.
- Even if not as accretive as in late 2021, UK transaction volumes have started to positively respond to these lower and more stable borrowing costs.
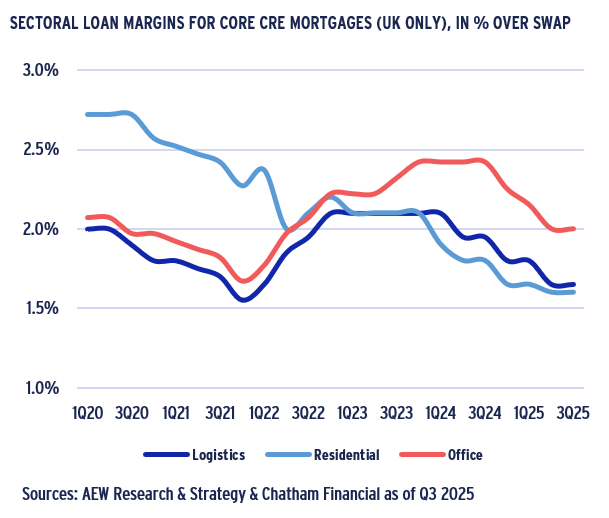
LOAN MARGINS FOR UK OFFICES TIGHTEN IN LINE WITH OTHER SECTORS
- As of Q2 2025 UK loan margins stand at 200bps, 165bps, and 150bps for the office, logistics, and residential sectors, respectively.
- Since Q3 2024, UK office loan margins tightened by over 40 bps, while margins for other UK sectors started tightening from Q4 2023.
- Residential UK loan margins were elevated before Q4 2021 but have since moved in line with logistics margins.
- After the initial Q1 2020 Covid shock, margins settled back down to their pre-Covid Q4 2019 by Q3 2021.
- However, high inflation and central bank rate hikes triggered margins past their Covid peaks for most of 2023. Remaining concerns on offices pushed their margins wider.
- UK office loan margins started tightening in Q3 2024 as many companies are asking staff to return to the office and vacancy rates are peaking as new supply comes down.
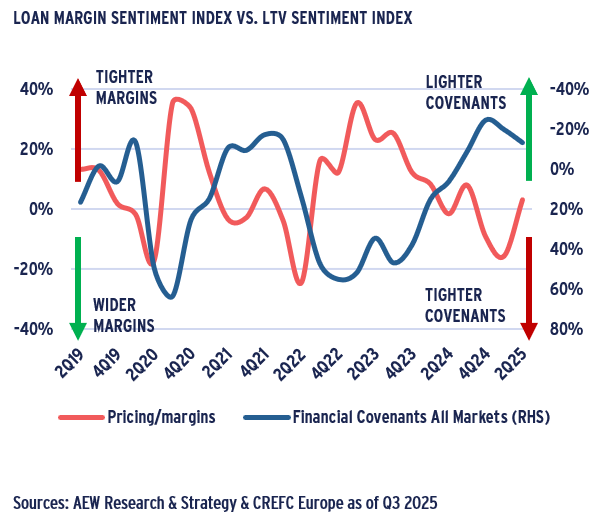
FINANCIAL COVENANT EASING TO PUSH UP LENDING AND DEAL ACTIVITY
- The latest Q2 2025 CREFC Europe data shows that financial covenant tightening peaked in 4Q 2022. However, in the most recent quarter this stopped easing.
- Lender’s sentiment on margins & pricings has been deteriorating from Q1 2023 with a reversal in 1H 2025.
- Contracting margin sentiment confirms that lenders need to compete with others on pricing and other terms to attract business. The recent reversal signals more caution.
- The overall easing pricing/margins trend reversed in both Q3 2024 and 1H 2025. Lenders’ pricing sentiment going forward will depend on rate cuts and collateral repricing.
- Similarly, financial covenant restrictions (LTV and ICR) peaked in Q4 2022 at 55% and have since steadily eased to -13% in Q2 2025.
- This most recent data confirms that more cautious lenders require both stricter covenants and wider margins.
- Based on this it would be reasonable to expect further covenant and margin stabilisation as long as central banks continue to cut rates with inflation targets met.
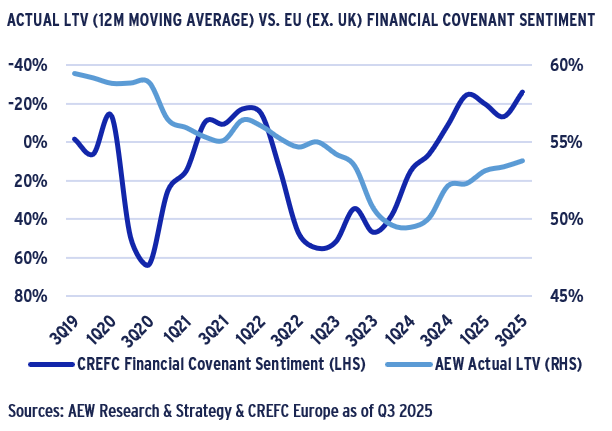
ACTUAL LOAN LTVS MOVE BACK UP REFLECTING COVENANT SENTIMENT
- CREFC Europe’s sentiment survey also allows an analysis of our in-house loan-by-loan data for Europe excl. UK.
- The historical correlation between the change in the CREFC financial covenant sentiment and actual loan LTVs is worth noting.
- High values of the covenant sentiment indicate that lenders are more restrictive in terms of financial covenants when providing debt to the borrowers.
- The persistent increase in the survey results in 2022-23 indicate that lenders were requiring tight covenants and led to lower actual loan LTVs as shown in the chart.
- As the covenant sentiment survey results were decreasing steadily in 2024-25, actual average LTV levels increased in Q2 2025 reflecting various lengths of delay.
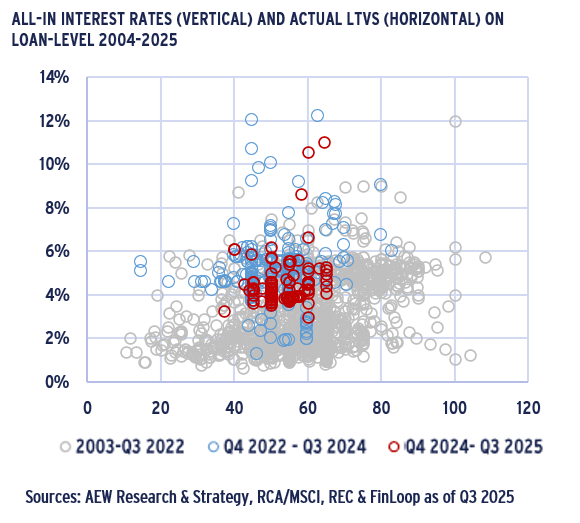
RECENT LOANS AT HIGHER RATES ON A 37-65% LTV SPECTRUM
- Our latest update shows our granular loan-by-loan database has increased to 1,745 loans from four sources: AEW, RCA/MSCI, REC, and FinLoop.
- As before, our data goes back to 2003 and we estimate that it covers about 10% of acquisition debt origination since 2010 and is believed to be representative for the market.
- Our scatter chart shows that the loans originated in the last four quarters are spread across a relatively tight LTV spectrum, ranging from 37% to 65%, with a median of 55%.
- This is higher than the 50% median LTV for loans in the previous two years (Q4 2022 to Q3 2024), confirming an increase in lenders' ability to take on more risk.
- Unsurprisingly, given current swap rates, the all-in interest rate of 4.6% for our new loans is consistently lower than the average of 5.0% for the previous two years in the database.
- As before, our granular loan-level data enables a more precise analysis of the impact of external market shocks, such as the recent increase in 5-year swap rates.
4.6% ALL-IN RATE DOWN FROM 5.2% RECORD HIGH IN H2 2023
- Our granular loan-by-loan data confirms that all-in interest rates in Europe excl. UK tightened to 4.6% as of Q3 2025, down 60bps from its record high of 5.2% in Q2 2023.
- This follows the 2016-21 period of extremely low interest rates, during which the all-in interest rate was primarily composed of the margin with Euribor swap rates near zero.
- High all-in interest rates in 2022-24 made debt unattractive for many leveraged equity investors. As a result, acquisition volumes in 2023 were half of those in 2022.
- In 2024 and H1 2025, transaction volumes have increased as lower borrowing costs have made debt accretive again.
- However, leveraged investors with legacy financings from the pre-pandemic period still face lower collateral values and increasing debt service costs when refinancing.
- This legacy may limit their ability to sell, recycle capital, and take advantage of lower interest rates.
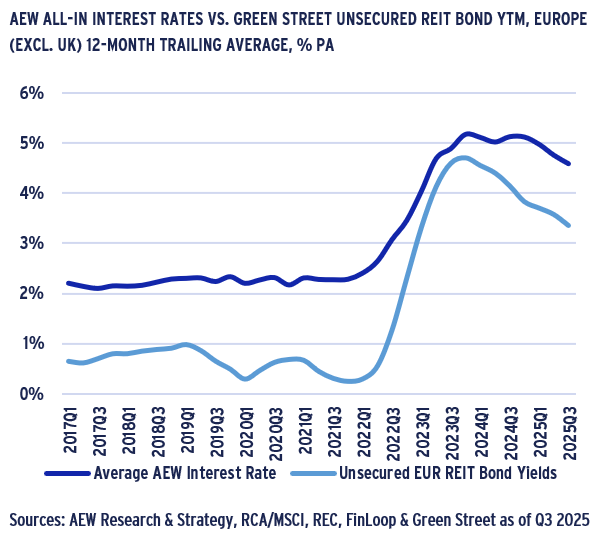
CRE BOND YIELDS INDICATE FURTHER LOAN RATE TIGHTENING AHEAD
- Euro-denominated unsecured REIT bond yields in secondary trading tightened by 135 bps to 3.35% as of Q3 2025, down from their peak of 4.7% in Q4 2023.
- This is consistent with past trends and 125 bps lower than our all-in loan interest rate of 4.6%.
- This latest 12-month trailing average confirms a high correlation between the two data series over long periods.
- It is reasonable to expect further tightening of loan rates in the next quarters, based on recent REIT bond yields.
- REIT bonds’ lower yields can be partly explained by lower implied LTVs at around 40-50% compared to 60% LTVs associated with secured mortgage loans at the loan level.
- The near 200 bps gap between bond yields and private loan costs observed in the pre-pandemic period narrowed significantly in 2023 as bond markets repriced risk more.
- Both loan rates and bond yields have decreased as central bank policy rate cuts and lower inflation have taken effect, despite rising geopolitical uncertainties.
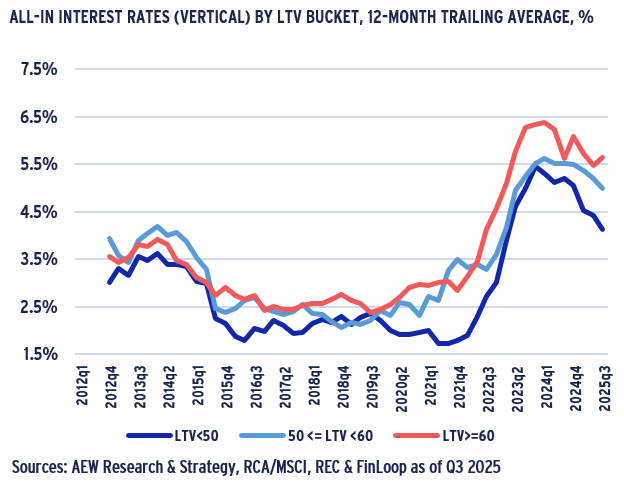
LENDERS PRICING LTV MORE CONSISTENTLY OVER LAST FOUR YEARS
- Our loan-level pricing across Europe for the three main LTV buckets enables us to identify valuable trends.
- In general, lenders seem to differentiate more logically and consistently across LTV categories since the inflation-related rate hikes in 2021-2022.
- This is confirmed by the fact that, after peaking at 5.5% in Q4 2023, below 50% LTV loans have tightened by 140bps to 4.1% in Q3 2025.
- In contrast, rates in the 50-60% average LTV bucket tightened by only 50 bps from their Q4 2023 peak of 5.5%.
- Higher LTV loans above 60% LTV tightened by 70bps, decreasing from 6.35% in Q4 2023 to 5.65% over the same period.
- Please note that the robustness of our data varies depending on the LTV category and the precise timing of the loan originations.
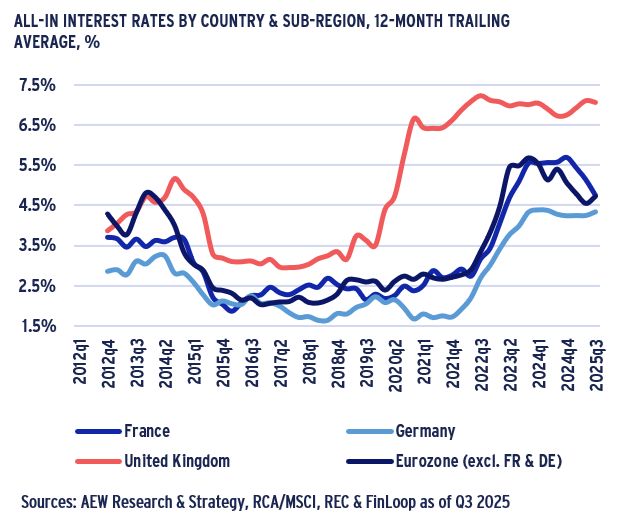
FRENCH & OTHER EUROZONE RATES TIGHTEN TO NEAR GERMAN LEVELS
- Across countries, German rates have consistently been the lowest among our major markets, remaining broadly stable at around 4.3% over the last two years.
- The low-cost covered bond funding available to German banks may explain these more competitive rates.
- The UK, on the other hand, has consistently shown higher all-in rates than the Eurozone due to its higher bond yields and swap rates.
- At 7.1% for Q3 2025 our UK loan rate is well ahead of the 5.6% prime rate derived from margins reported by Chatham Financial, reflecting non-prime nature of our own sample.
- There is good news for French and other Eurozone rates as they have both tightened by 100 bps from 5.7% to 4.7% over the last three and eight quarters, respectively.
- This tightening is in line with the prime Northern European rate changes as derived from Chatham Financial’s margins.
NO CLEAR DIFFERENTIATION IN PROPERTY TYPE LOAN PRICING
- Across property sectors, our loan-level data does not reveal any clear or consistent differentiation in loan pricing.
- Although not shown here, this inconsistency is also evident when including the UK data.
- This lack of consistency is likely due to the wider range of collateral quality and LTVs compared to what is included in the Chatham Financial’s prime-only loan pricing data.
- The timing of refinancing requirements and legacy loan positions related to retail and office-backed loans may also play a role.
- Our database includes only senior secured loans above €15mln for the purposes of acquisition or refinancing.
- Therefore, it excludes development and bridge loans, as well as junior or mezzanine loans.
- Our loan data is subject to survival bias and excludes failed refinancings, extensions and restructurings such as for low quality collateral e.g. secondary offices.
LOAN ORIGINATION VINTAGE SPECIFIC METHODOLOGY UPDATE
LATEST DATA USED TO UPDATE DFG ASSUMPTIONS
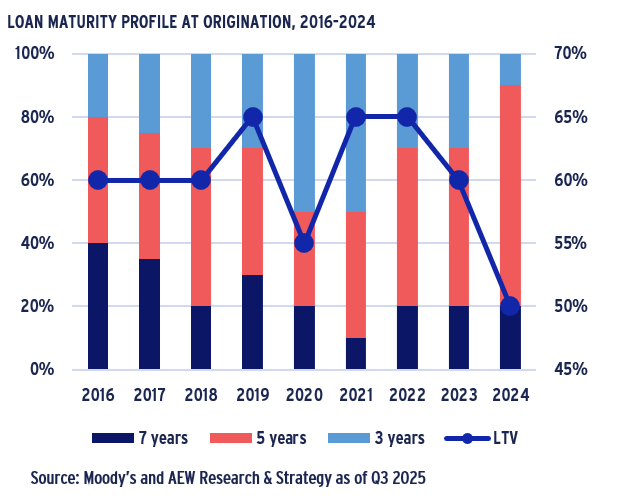
- Our debt funding gap estimate uses three assumptions: (1) loan maturity; (2) loan-to-value (LTV) ratio at origination; (3) loan maturity extensions and; (4) refinance LTV.
- In terms of maturities, our internal database shows that when interest rates are higher, maturities for new loans tend to be shorter. 2024 data shows fewer 3-year loans.
- As before, we assume each origination vintage volume split into three maturity groups: short (3-years), medium (5-years) and long (7-years) maturities.
- Secondly, data from Moody’s allows us to assume loan origination vintage-specific LTVs, with the unpublished 2024 vintage assumed at 50% LTV, as shown in the chart.
- Thirdly, the latest market feedback trigger a refinement in our extension assumption to reflect 35%, 25% and 15% of 2023, 2024 and 2025 maturities to extend by two years.
- Lastly, we assume a 55% refinancing LTV going forward based on the recent average historical origination LTVs.
VINTAGE SPECIFIC LOAN MATURITIES SPREAD DFG OVER TIME
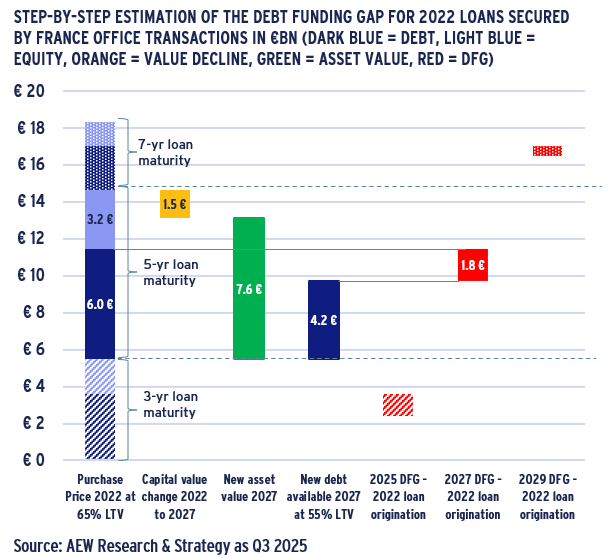
- Our methodology is illustrated by the example of 2022 French office acquisitions as follows:
- Investors acquired €18.3bn of French offices in 2022
- These deals were financed using different loan terms, 30% of loans are assumed at 3-years, 50% at 5-years and the 20% for 7-years as shown in the left stacked bar.
- 65% LTV is assumed across all three loan maturities.
- The chart focuses on 5-year (€6bn) loans and projected -17% value decline (€1.5bn) at maturity in 2027.
- New debt volume is estimated at €4.2bn or 55% LTV of the €7.6bn new collateral value and DFG for 5-year loans is estimated at €1.8bn in 2027 in red.
- DFGs of €1.2bn in 2025 for 3-year loans and €0.6bn 2029 for 7-year loans are calculated similarly, and 15% of the 2025 DFG is assumed to extend to 2027.
- The cumulative DFG for 2022 French office financings is therefore €2.5bn and spread over 2025, 2027 and 2029.
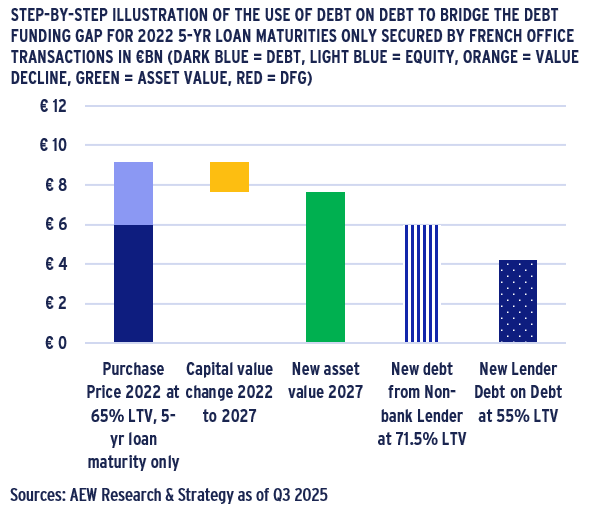
DEBT-ON-DEBT OR BACK-LEVERAGE HELPS BRIDGE DEBT FUNDING GAP
- Any need for investors to inject additional equity to bridge the DFG has been limited as many funds are facing redemptions and lack new capital.
- However, debt-on-debt offers another solution. It allows for a non-bank lender to offer a refinancing at the new higher LTV without any new equity capital, as shown in the chart.
- In return for (re-)financing a high LTV legacy (or new) loan, the loan-on-loan (back leverage) lender provides a 55% LTV unsecured corporate loan to a new non-bank lender.
- Both parties benefit from this growing collaboration. The non-bank lender reduces its funding needs (55-70% LTV) and increases returns with low-cost debt-on-debt financing.
- For the back leverage lender, reduced CRE mortgage exposure is replaced by unsecured loans with lower capital reserve requirements allowing it to offer low cost financing.
- According to CREFC Europe estimates, European back leverage stands at near €30bn in outstanding balance.
ESTIMATED DEBT FUNDING GAP & CRE LOAN LOSSES MODERATE
€74BN EUROPEAN DEBT FUNDING GAP DOWN 18% FROM 2023 ESTIMATE
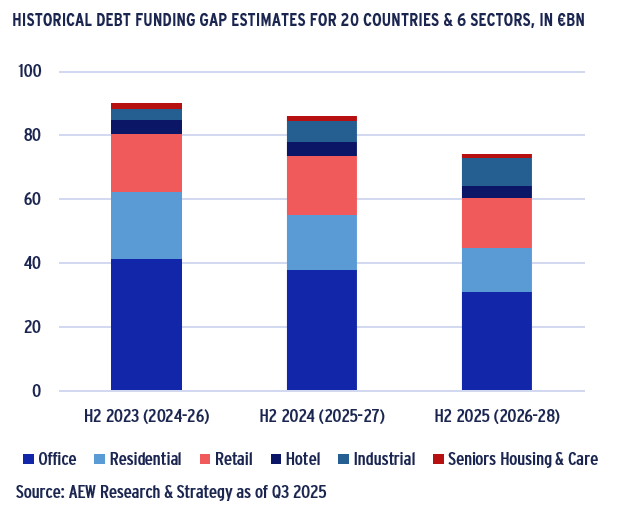
- Since we have consistently estimated debt funding gap (DFG) for 20 countries and 6 sectors we show our DFG evolution -- even if the three-year periods covered shifted.
- Across all sectors, our three-year forward-looking DFG has come down by 18% from €90bn in 2023 to €74bn in 2025.
- Across all three estimates, the sector with the largest volume of DFG has been offices, reflective of larger transaction volumes in the sector.
- The largest volume of DFG has always been concentrated in 2023-2024, as the result of increasing interest rates and strong repricing across all sectors.
- As 2023 and 2024 passed, most of the loans managed to get refinanced, while non-refinanced loans were extended by 1-2 years into the future.
- This is reflected in our 35%, 25%, 15% extension, assumption, applied to loans maturing in 2023, 2024, and 2025, respectively.
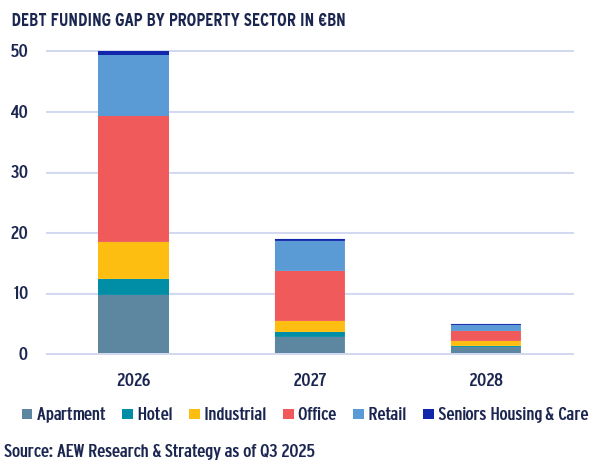
€74bn EUROPEAN DEBT FUNDING GAP – LED BY OFFICES & RETAIL
- Office-backed loans account for 41% of our €74bn DFG, followed by retail loans at 21%, residential at 19% and others at 18% of the total 2026-28 DFG.
- Our estimated DFG extends further into 2031, when the 7-year loans originated in 2024 mature.
- Absolute DFG volumes reflect historical acquisitions and loan origination volumes in each of the sectors as well as the historical reductions and projected capital values.
- Based on our latest estimates, the relative DFG (as a % of the original loan originations) across Europe has come down to 12% from 13% a year ago.
- If we rank the sectors by the DFG as a share of their sector specific loan origination, retail ranks top at 17%, followed by offices at 15%, residential at 9% and other sectors at 8%.
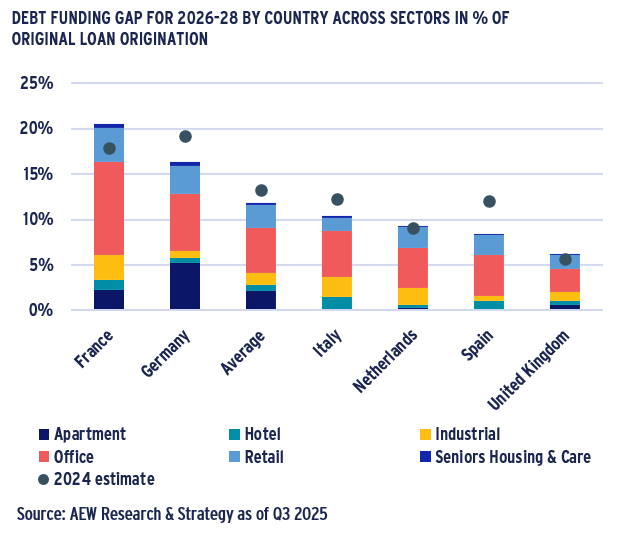
FRANCE MOVES AGAINST TREND & RANKS TOP FOR RELATIVE DFG
- Despite coming down to 12% from 13% a year ago, the relative DFG change over the last year varies per country.
- France’s €17bn DFG stands out as the highest in Europe at 20% of original loans. With this increase from last year’s 18%, France moves against the overall European trend.
- This change is due to a more pessimistic outlook on French capital values, particularly logistics and offices, compared to last year’s projections.
- Germany’s €23bn DFG ranks top in terms of absolute level but comes second in relative terms, representing 16% of original loans (down from 19% last year).
- Italian and Spanish figures are below the European average, at 10% and 8%, respectively.
- As before, the UK is on the lower end with DFG of just €11bn, or 6% of original loan volumes.
- The German residential-linked DFG is larger than elsewhere in Europe, due the sector’s large share in German deal volumes.
CRE LOAN LOSS ESTIMATE BELOW ACTUAL CMBS GFC LOSSES
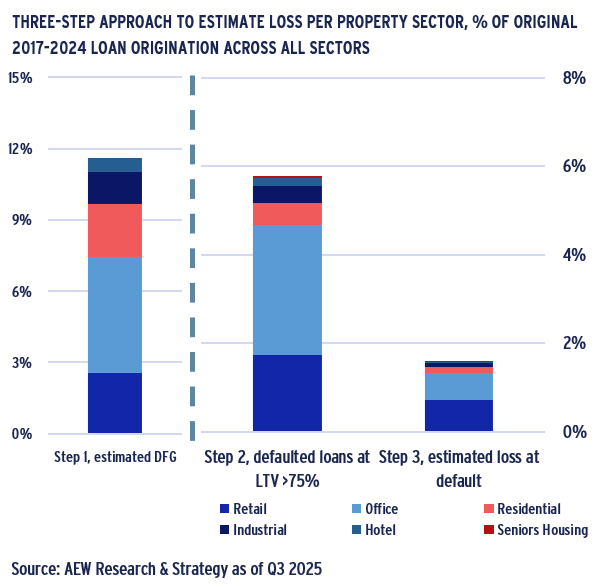
- Our DFG does not directly translate into expected losses for CRE lenders. However, we do estimate losses across all 20 countries’ six property sectors, and eight loan vintages in three steps:
- 1) We start with the estimated DFG of 11.8% of original 2017-24 loan originations as explained above.
- 2) Loans in a specific vintage segment are assumed to not refinance if the LTV at refi is above 75%. In that case the loan defaults, and the lender would repossess and sell the collateral to recover its principal. We disregard any unpaid interest.
- 3) At default, we assume enforcement-related cost of 25% of the estimated collateral value at resale, leaving 75% to be recovered by the lender to cover its position.
- Based on this, 5.8% of CRE loans are estimated to default on maturity and losses for the 2016-24 vintages come at 1.6%.
- This implies an estimated loss on 2016-24 loans of €10.4bn.
- Our estimated loan losses are concentrated in the office and retail sectors, which suffered the largest repricing since 2016.
- Our latest 1.6% loss estimate is below both 2.3% historical actual European CMBS losses and our previous estimate of 1.8%.
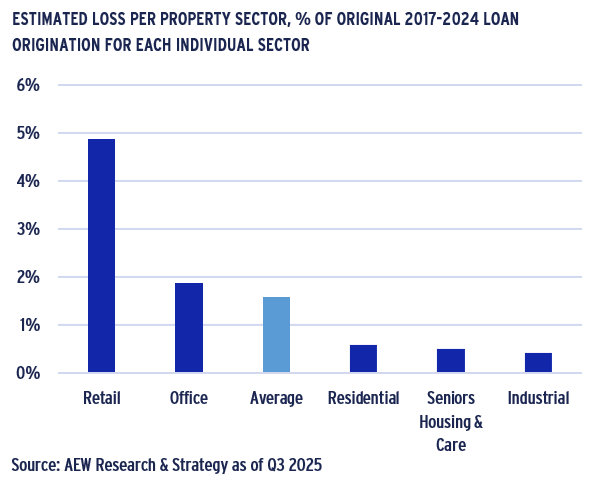
ESTIMATED LOSSES ON RETAIL MORE THAN 3 TIMES OVERALL AVERAGE
- Breaking out our loss results per sector and country allows us to highlight the most interesting differences.
- Losses estimated for retail-backed loans in the 2017-24 loan vintages stand at 5% of all retail loans originated - more than three times the overall average across all sectors.
- Please note that the denominator for this graph is each sector’s loan origination – not the all-sector cumulative loan originations.
- This high loss for retail loans is triggered by more significant and earlier collateral value declines since 2018. This is further emphasized by a more modest projected value recovery.
- Office-backed loan losses are projected at 1.9%, just above the overall average. Even if offices had significant value declines, they occurred later in the cycle and a recovery is projected in the future.
- All other sectors show estimated losses below 1.0%, which is very modest. Low level losses in these sectors are easily reserved against by banks in case covenant defaults trigger cash traps.
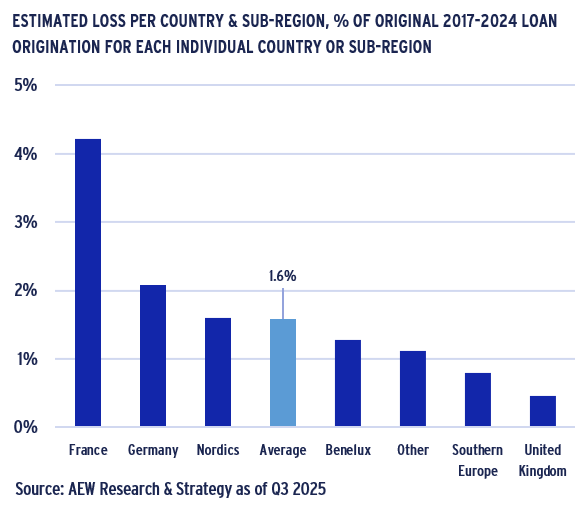
PROJECTED LOSSES ON FRENCH ASSETS MOVE INTO TOP POSITION
- Looking at the geographic breakdown, estimated losses for French collateral-backed loans in the 2017-24 loan vintages stand at 4.2% - notably higher than the overall 1.6% average.
- Again, it should be noted that the denominator for this graph is each country’s loan origination – not the loan originations across all 20 countries covered.
- Higher French estimated losses result from higher capital value declines in 2022-23 and a less robust projected recovery in 2025-27, pushing more loans beyond the assumed 75% default LTV.
- Germany and the Nordics losses are projected slightly above the overall average at 2.1% and 1.6%, respectively.
- All other European countries and sub-regions, each show cumulative losses below 1.6%, the overall regional average.
- These estimates are below the historical losses seen in post-GFC European CMBS loans. Regulators might have used these losses as a basis for setting lenders’ capital reserve requirements.
This material is intended for information purposes only and does not constitute investment advice or a recommendation. The information and opinions contained in the material have been compiled or arrived at based upon information obtained from sources believed to be reliable, but we do not guarantee its accuracy, completeness or fairness. Opinions expressed reflect prevailing market conditions and are subject to change. Neither this material, nor any of its contents, may be used for any purpose without the consent and knowledge of AEW. There is no assurance that any prediction, projection or forecast will be realized.