BORROWING COSTS COME DOWN WHILE REFINANCING CHALLENGES REMAIN
- Eurozone inflation came down faster than expected, pushing 5-year Euro swap rates down more than previously projected. Central banks rate cuts are now expected to be delayed with swap rates forecasted to come out just above 2% by year-end 2025.
- As a result, Eurozone CRE borrowing costs are projected to come down to 3.4% by year-end 2025 while UK costs are forecasted to come down to 5.0% by year-end 2025. UK swap rates and margins are estimated 120 bps and 40 bps above the Eurozone’s.
- Given the positive spread between prime yields and debt costs, we expect debt to become accretive again in the Eurozone in Q1 2024 and Q4 2024 for the UK. This is a bit sooner than previously projected and should allow investors to become more active.
- Recent data from the private loan market confirms the reversal in CRE borrowing costs, which is further endorsed by the latest available data for CRE bond yields. REIT bond yields are now at 4.3% and have come down in line with CRE borrowing costs.
- Despite these improved costs for CRE borrowers, many still face issues with the re-financing of legacy loans due to the reduction in collateral values. Our 20-country European debt funding gap estimate remains at €90bn.
- This €90bn estimate implies that nearly 16% of European real estate loans are expected to be difficult to refinance, as a share of loans originated in 2018-21. This is higher than the US and APAC estimates of 14% and just below 8% (excl. development loans).
- Compared to the 16% European average estimate, European retail-backed loans are projected to have the highest relative debt funding gap at 23%, followed by 20% for offices. Logistics-backed loans are estimated to come in at below 5% only.
- However, not all hard-to-refinance loans are expected to trigger a default or loss for the lender. The impact on various sectors depends on the precise extent of collateral and rate distress for each country across each of the 2018-21 loan vintages.
- Based on our three-step methodology, AEW estimates 7.5% of the €572bn 2018-21 CRE loan originations to default and their associated losses are projected at 2.5%. These estimated losses are in line with historical European CMBS loan losses post-GFC.
- This projection implies defaults and losses for European lenders of €42.5bn and €14.5bn, respectively. Losses estimated for retail-backed loans across Europe are near 11% with German loans near 4.5% - more than four and two times the overall 2.5% average.
- As far as lenders’ ability to absorb these losses, we note that 19% of CRE bank loans are in the +100% LTV category across nine key European countries. Growth in CRE bank lending moderated to 2% pa in the year up to Q3 2023 and CRE loans make up less than 7% of EU banks’ total lending books and only 4% of their NPL books as of year-end 2022.
- Both low CRE NPL and high coverage ratios raise limited concerns for European banks in general. Better post-GFC capitalised and regulated lenders should affect CRE markets less, even if the extent of CRE loan losses could be expected similar to GFC.
LOWER SWAP RATES EXPECTED TO MAKE DEBT ACCRETIVE SOONER
NORMALISED EUROZONE INFLATION PUSHES SWAP RATES DOWN
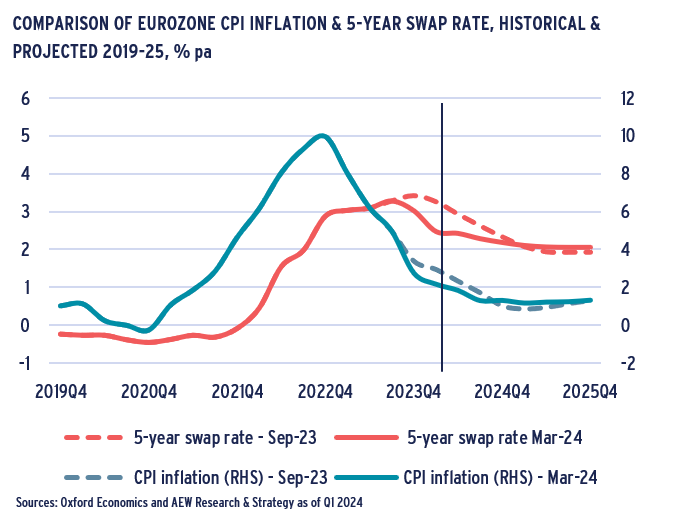
- Headline inflation in the Eurozone fell to below 2.8% y/y in Q4 2023 from the 10% Q4 2022 peak as prices continued to come down sooner than previously projected.
- Oxford Economics (OE) latest forecasts for inflation show a further decline to 1.3% for Q4 2024, well below the ECB’s 2% target.
- Despite this faster than expected inflation decline, OE forecast the ECB policy rate to settle at 2.0% for Q4 2025 – up 25 bps from their Sep-23 forecasts.
- As shown in the chart, 5-year swap rates followed these faster-than-expected declines in inflation in the last two quarters.
- However, 5-year swap rates are projected to come in at 2.1% in Q4 2025. This is nearly 20 bps higher than OE’s Sep-23 forecasts.
- These changes reflect the lingering concerns about wage inflation, better than expected US growth and the current geopolitical uncertainties.
DEBT PROJECTED TO BE ACCRETIVE SOONER THAN EXPECTED
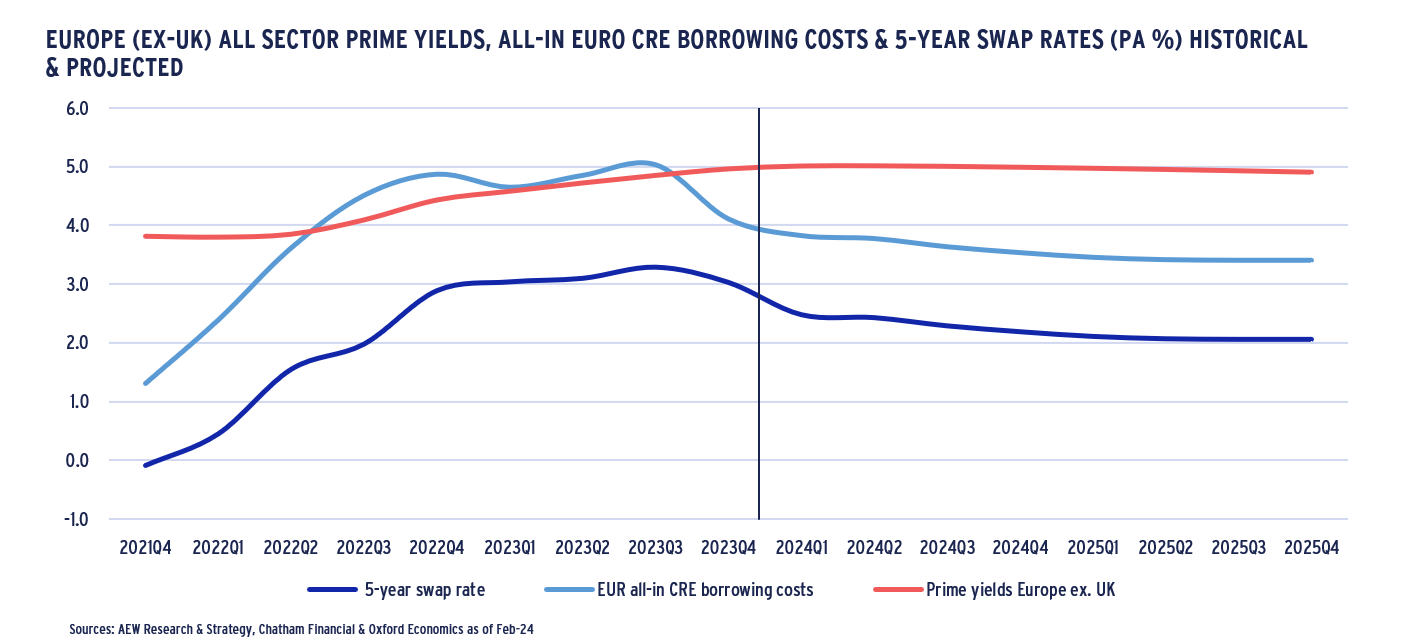
- Based on the latest data, both Eurozone and UK 5-year swap rates have come down and are forecast to further moderate sooner than expected six months ago.
- As a result, commercial real estate (CRE) borrowing costs are projected to decline as well, albeit not to pre-Covid record lows.
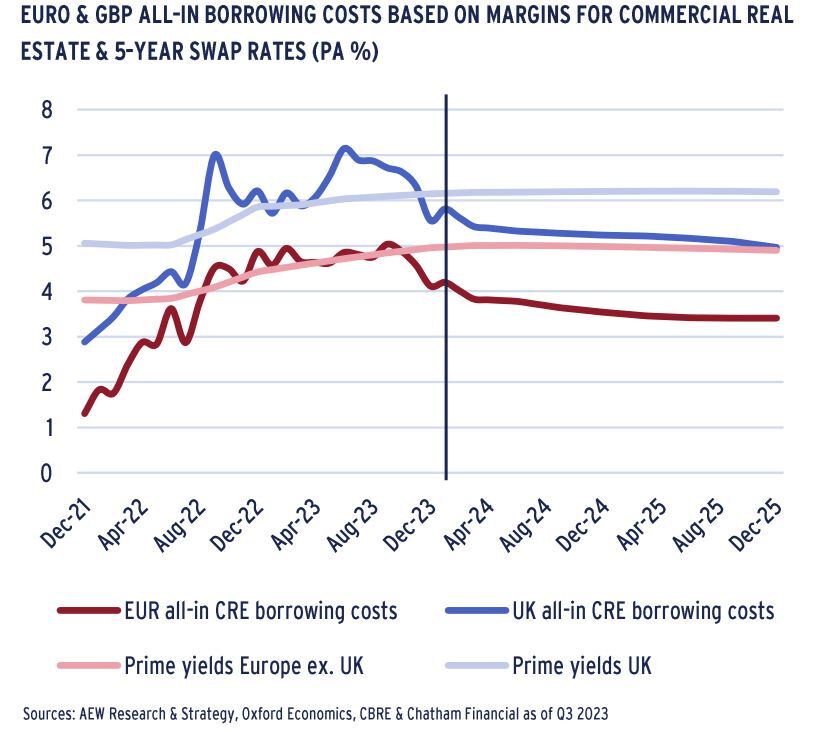
- Eurozone CRE borrowing costs are expected to come down to 3.4% by Q4 2025 from 5.0% in Q3 2023.
- With UK swap rates projected to come in more quickly, UK all-in borrowing costs are projected to come down to 5.0% by Q4 2025, still 160 bps higher than in the Eurozone.
- The UK forecasts include a 120 bps higher UK 5-year swap rate and 40 bps higher margin compared to the Eurozone.
- As before, cross-sector prime yields in the Eurozone and UK forecasted to be at 4.9% and 6.2% by year-end 2025.
- Assuming debt is accretive when there is a 100 bps positive spread between prime yields and CRE debt costs, accretive debt will be back in the Eurozone in Q1 2024 and Q4 2024 for the UK.
- This is a bit sooner than projected in our Nov-23 published 2024 Outlook and should allow investors to become more active in 2024 as real estate prices are expected to have bottomed out.
REITS' BALANCE SHEET LTVS ABOVE PRIVATE FUNDS'
- Lenders and borrowers’ risk appetite is not only expressed in pricing, but also in loan-to-value (LTV) ratios.
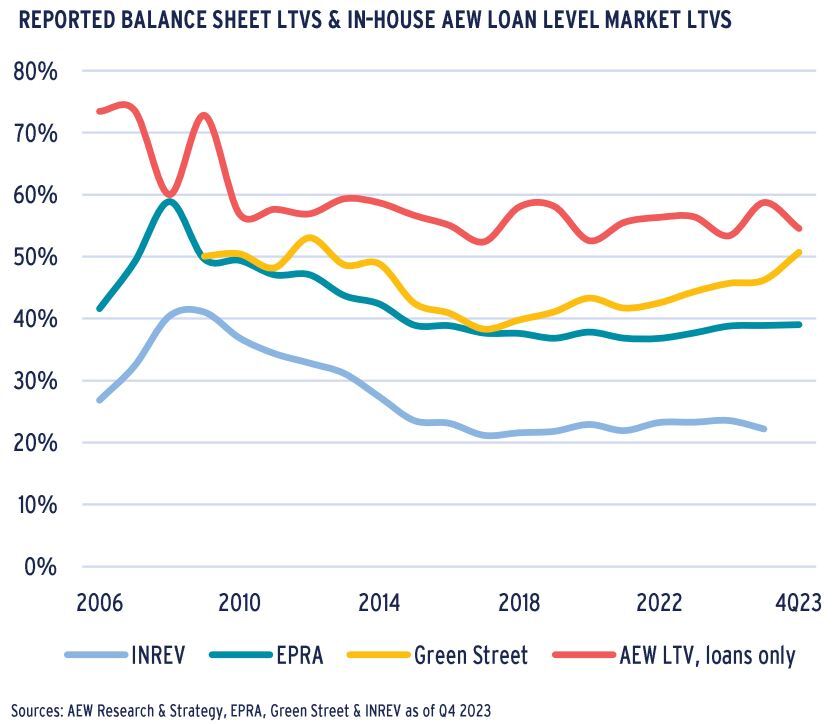
- 2H23 data shows a stabilisation in reported EPRA (i.e. listed real estate companies) balance sheet LTVs and a decline in INREV’s private real estate fund LTVs implying a widening gap.
- Reported Q3 2023 INREV LTV of 22% and the Q4 2023 EPRA LTV at 39% have increased by 0.3% and 2.2% since year-end 2021, respectively. This confirms the gap in private to public LTVs.
- Similar to our Aug-23 report, Green Street data shows a stronger upward trend for REIT LTVs than the EPRA data. This is due to their definition of LTV, which includes unfunded liabilities.
- We take comfort from the fact that all LTV series remain well below 2008-09 record levels.
- Our in-house loan-level LTV market data shows a decline in Q4 2023 to 54.5% after a surprise increase in Q3 2023 to 58.7%.
- Our loan level data disregards non-leveraged transactions. The latest results confirm the historically higher and more volatile LTV levels, still ranging between 52% and 60% over the last 10 years.
BORROWING COSTS ALREADY CAME DOWN IN H2 2023
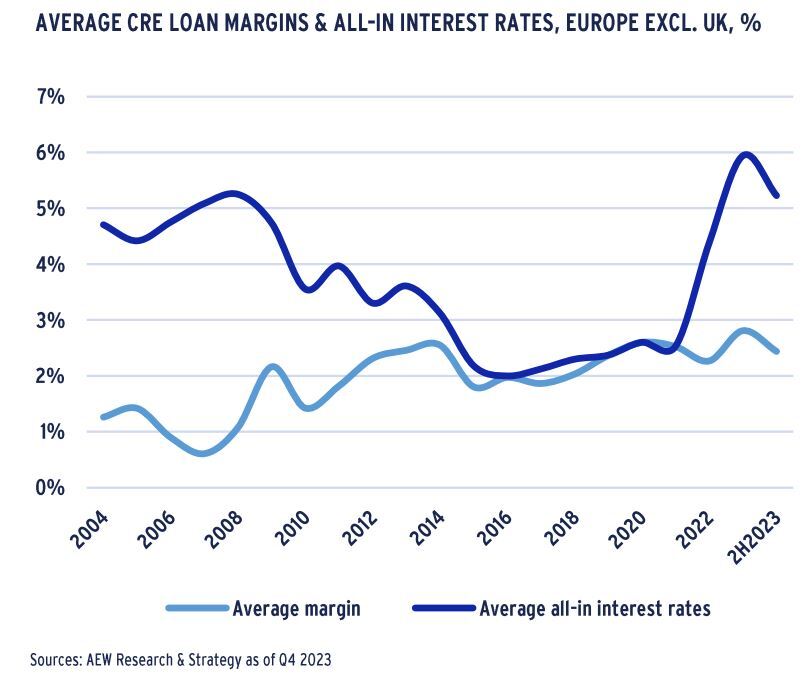
ALL-IN RATES DOWN FROM THEIR RECORD HIGH IN H2 2023
- Our granular loan-by-loan data confirms that all-in interest rates in Europe excl. UK came back down to 5.2% as of year-end 2023. This is 70 bps down from its record high of 5.9% of mid-2023.
- Despite this recent reversal, high all-in interest rates made debt unattractive for many leveraged equity investors. As a result, 2023 acquisitions volumes were half those recorded in 2022.
- In 2022 and 2023, buyers and sellers’ expectations created a bid-ask spread which has pushed prices down and yields up.
- Leveraged investors with legacy financings face lower collateral values and increasing debt service when refinancing, limiting their ability to take advantage of re-pricing in the markets.
- Many investors remain cautious to avoid further valuation adjustments. While it is difficult to perfectly time the cycle, lower debt costs should help smooth the path to more active investing.
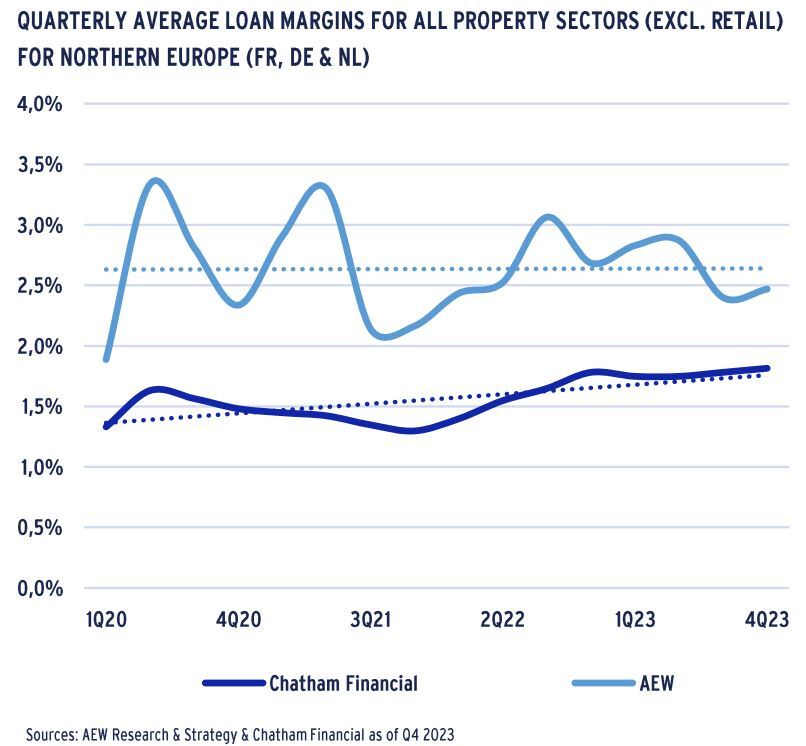
LOAN MARGINS STABILISE IN H2 2023
- CRE loan margins stabilised in H2 2023 based on both the Chatham Financial and our AEW in-house loan data.
- Despite this recent flattening out, margins have trended up modestly by 30 bps since year-end 2019.
- Historically, our AEW loan margins show a more volatile pattern and elevated level compared to Chatham Financial’s margins as our periodic loan data samples remain different from each other.
- Both margin series show the impact of the initial Covid lockdowns in Q1 2020, the start of the war in Ukraine in Q2 2022 as well as subsequent central bank rate hikes.
- H2 2023 margin data shows margin stabilisation which is mostly driven by inflation coming down from record highs and the more moderate outlook for central bank rate hikes.
- Our in-house data remains less stable when compared on a quarterly basis, highlighting the need for industry-wide loan-by-loan data, like the Moody’s initiative, to pool these data.
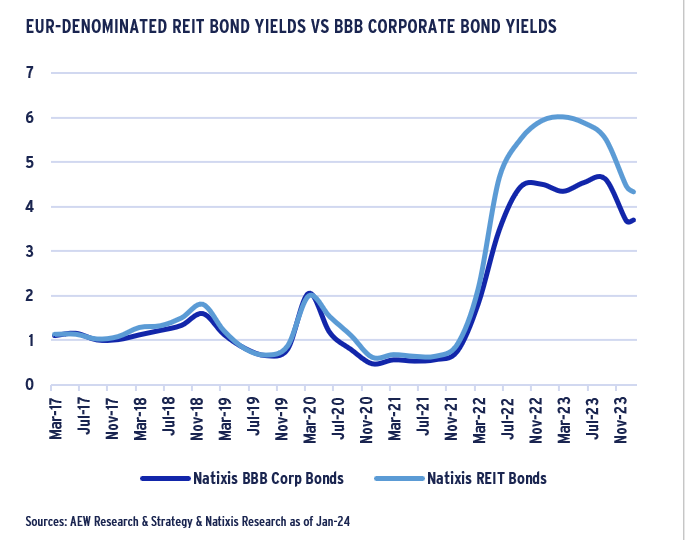
REIT BOND YIELDS TIGHTEN 170 BPS SINCE MAR-23 TO 4.3%
- The latest data for both BBB corporate bonds and REIT bond yields further confirm that borrowing costs have come down.
- REIT bond yields stand at 4.3% as of Jan-24 and have tightened by 170 bps since their record high of 6.0% in Mar-23.
- This is a partial return to the high historical correlation between REIT bond and BBB corporate bond yields after a period of disconnect from mid-2022.
- Given the continued dominance of banks in European CRE lending and the limited number of REIT bond issuances, it is easy to overstate the relevance of these bond yields.
- As mentioned before, the inclusion of a small number of unrated and/or illiquid REIT bonds can move a yield series significantly.
- Nevertheless, European REIT bond yields confirm that borrowing costs have come down in the last 10 months.
- However, despite this repricing of the credit risk, refinancing risk remains a key focus for investors and lenders alike.
EUROPEAN DEBT FUNDING GAP IN RELEVANT CONTEXT
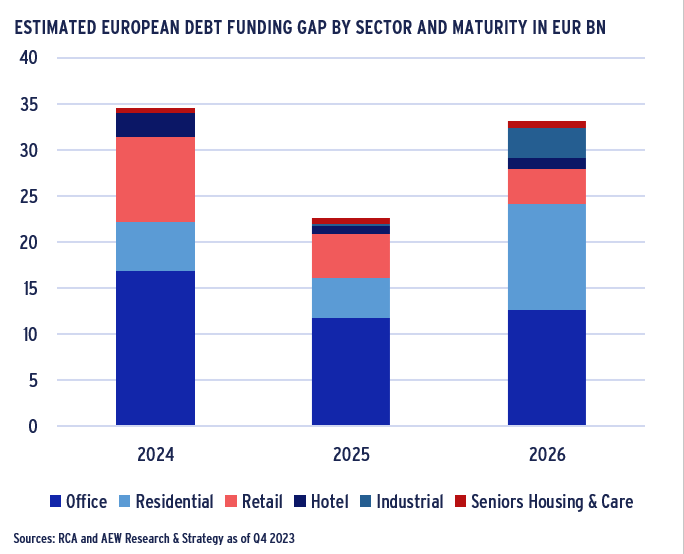
€90BN EUROPEAN DEBT FUNDING GAP - LED BY RETAIL & OFFICES
- To assess the market impact from lower collateral values and higher rates on upcoming refinancings, we estimate a debt funding gap (DFG) and explained our methodology in past reports.
- As reported in our Nov-23 European outlook, offices-backed loans account for over 45% of our €90bn DFG across 20 countries, followed by residential at 23%, retail at 20% and others at 10% of the total.
- Since we use 5-year loan terms, acquisition volumes and LTVs to estimate annual loan originations, our estimated DFG increases in 2026, as a result of the 2021 rebound in volumes post-Covid.
- Even if the €90bn DFG is a very large number, some context is needed to appreciate its overall market impact.
- To provide a relative perspective, the DFG can be estimated as a percentage of all loan originations made over the period.
- Also in the geographic context, Europe can be compared to other global regions, including the U.S.
EUROPEAN RELATIVE DFG PROJECTED AT 16%, HIGHEST GLOBALLY
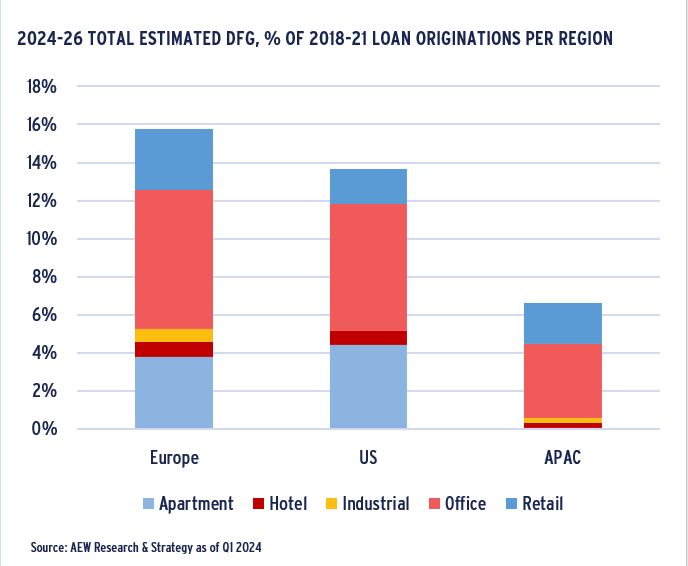
- By taking each global region’s DFG as a share of its total originated loan volumes, we rank each region by estimated relative DFG.
- The €90bn DFG in Europe represents 16% of all loan originations from the 2018-21 period.
- Europe is projected to have the biggest relative DFG across our three global regions, followed closely by the U.S. at 14%.
- Key APAC markets, include tier 1 Chinese markets show a much more modest DFG at below 8% -- about half Europe’s level.
- Across all three regions, office-backed loans are consistently expected to be the biggest worry, as they suffered the biggest capital value declines.
- Not all hard-to-refinance loans will trigger a default or loss for the lender, on which we will elaborate later in this report.
- Excluding development loans due to lack of data might also favour APAC and US estimated DFG relative to Europe.
- Lenders’ ability to absorb potential losses from loans which are not able to be refinanced are expected to vary across countries and institutions.
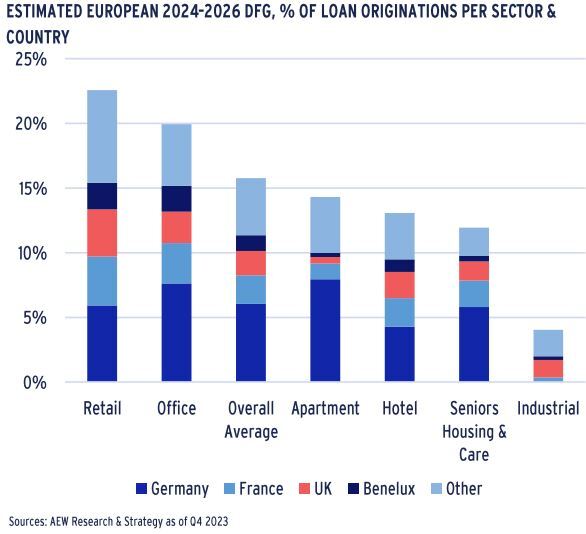
RETAIL AND OFFICE DFG WELL ABOVE EUROPEAN AVERAGE
- By taking each sector’s DFG as a share of its own sector’s originated loan volumes, we rank each sector by its relative DFG.
- At 23%, the retail sector has the highest relative debt funding gap followed by 20% for offices. Both are well above the European average of 16% of all loan originations from the 2018-21 period.
- Our relative DFG estimates the share of maturing loans that will not easily refinance given collateral value changes and lenders’ current LTV and loan pricings.
- In the case of logistics-backed loans, less than 5% of loans maturing over the next three years are expected to have difficulty to refinance – less than a third of the level seen across all sectors.
- The impact on the various sectors depends on the precise extent of the collateral value declines. Based on the latest data available, we can estimate defaults and losses next.
CRE LOAN LOSS ESTIMATE AT 2.5% FOR 2018-21 VINTAGES
€15BN CRE LOAN LOSS ESTIMATE IN LINE WITH ACTUAL CMBS GFC LOSSES
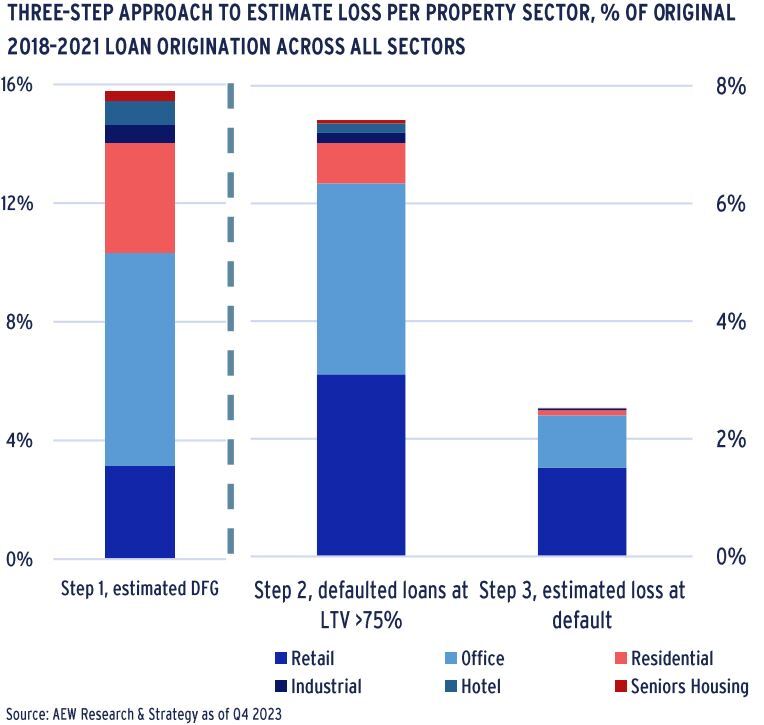
- Our DFG does not directly translate into expected losses for CRE lenders. However, we do estimate losses across all 20 countries’ six property sectors, and four loan vintages in three steps:
- We start with the estimated DFG of 16% of original 2018-21 loan originations as explained above.
- Loans in a specific vintage segment are assumed to not refinance if the LTV at refi is above 75%. In that case the loan defaults, and the lender would repossess and sell the collateral to recover its principal. We disregard any unpaid interest.
- At default, we assume enforcement-related cost of 25% of the estimated collateral value at resale, leaving 75% to be recovered by the lender to cover its position.
- Based on this, 7.5% of CRE loans are estimated to default on maturity and losses for the 2018-21 vintages come at 2.5%.
- This implies an estimated loss on 2018-21 loans of €14.5bn.
- Our estimated loan losses are concentrated in the retail and office sectors, which saw the largest repricing since 2018.
- As before, our loss estimate remains in line with historical post-GFC European CMBS losses at 2.3%.
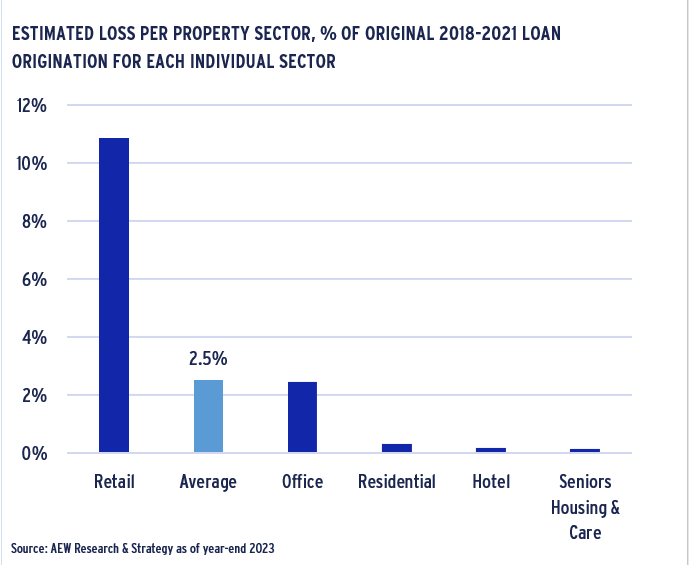
ESTIMATED LOSSES ON RETAIL MORE THAN 4 TIMES OVERALL AVERAGE
- Based on the overall 2.5% loss estimate, we can break out our results per sector and country for more interesting differences.
- Losses estimated for retail-backed loans in the 2018-21 loan vintages are nearly 11% as a share of all retail loans originated - more than four times the overall average across all sectors.
- Please note that the denominator for this graph is each sector’s loan origination – not the all-sector cumulative loan originations.
- This high loss for retail loans is triggered by more significant and earlier collateral value declines since 2018 without a projection for a recovery in subsequent years when compared to other sectors.
- Loans backed by offices are projected to have 2.5% losses, which are in line with the overall average. Even if offices had significant value declines, they occurred later in the cycle and a recovery is projected from 2024.
- All other sectors show estimated losses below 0.3%, which is very modest. Low level losses in these sectors are easily reserved against by banks in case covenant defaults trigger cash traps.
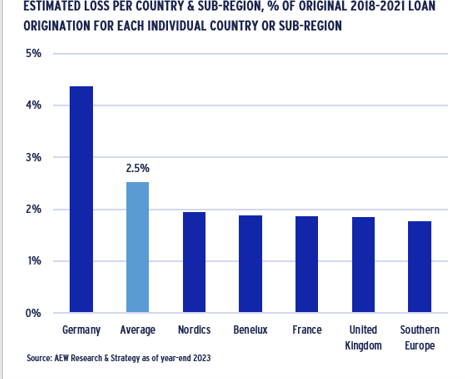
LOSSES ON GERMAN COLLATERAL IS DOUBLE THE EUROPEAN AVERAGE
- Looking at the geographic breakdown, estimated losses for German collateral-backed loans in the 2018-21 loan vintages are nearly 4.5% - nearly twice the overall 2.5% average across all sectors.
- Again, it should be noted that the denominator for this graph is each country’s loan origination – not the loan originations across all 20 countries covered.
- The German estimated loss is triggered by a more significant capital value declines in 2022-23 with a less robust projected recovery in subsequent years when compared to other countries.
- All other European countries and sub-regions, each show cumulative losses below 2%, below the overall average.
- Estimated country-level losses at 2% are below the historical range seen in post-GFC European CMBS loans. It seems that regulators have used these as a basis for lenders’ capital reserve requirements.
EUROPEAN BANK CRE EXPOSURES & RESERVES
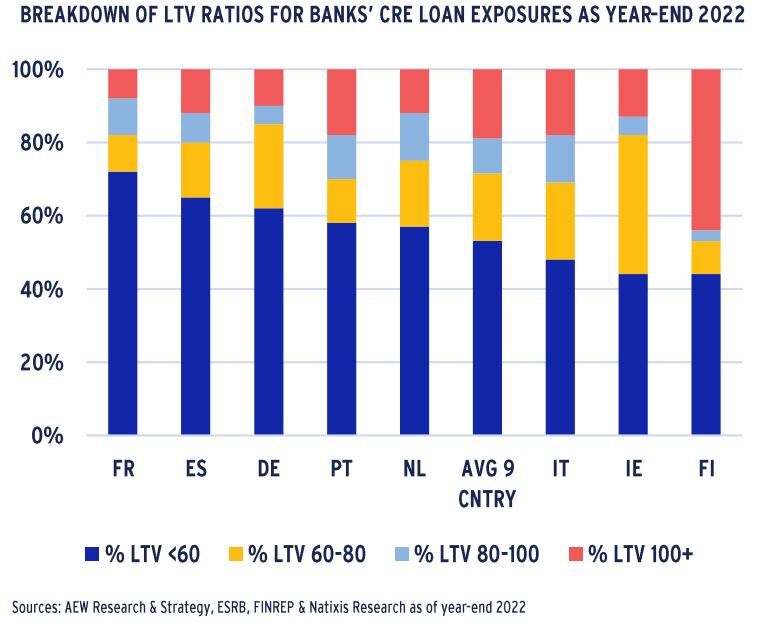
FRENCH & SPANISH BANKS REPORT LESS HIGH LTV LOAN EXPOSURE
- As a final step to assess the impact of our CRE loan loss estimates on lenders, we have taken a closer look at how European banks are positioned to absorb both upcoming defaults and losses.
- Across nine key EU countries, <60% LTV loans make up 53% of the book, while 19% of loans are in the +100% LTV loans.
- To state the obvious, high LTV loans are more likely to be hard to refinance, suffer defaults and cause losses to the lender.
- French, Spanish and German banks are least exposed to high LTV CRE loans as shown in the chart.
- Finnish, Irish and Italian banks have large exposures to high LTV loans – with Finland with 44% CRE loans at +100% LTV levels.
- Reported LTVs might not be entirely consistent as they might not be updated as frequently in each country.
- Given recent collateral market value declines, if valuations have not been recently updated, they are unlikely to reflect the mark-to-market LTVs.
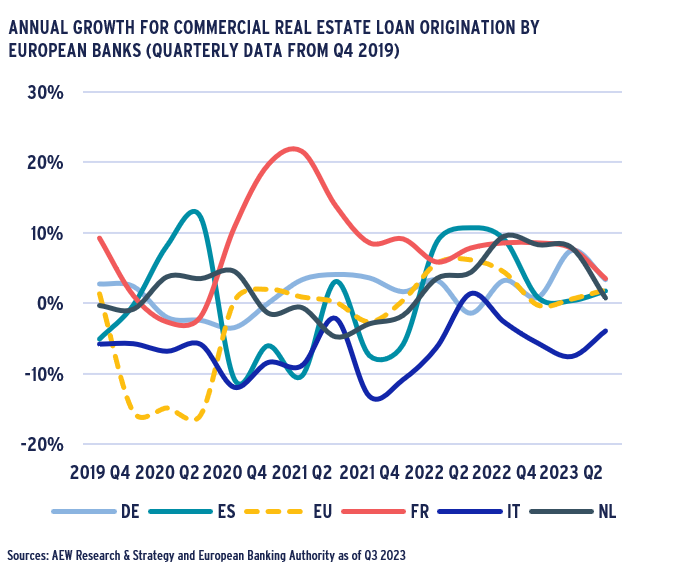
CRE BANK LENDING MODERATES IN 1H 2023 ACROSS EU
- The latest EBA data shows that CRE lending growth moderated to 2% pa in the year up to Q3 2023.
- In fact, there was an overall reduction in annual bank loan origination to CRE across the EU of -2% pa since Q4 2019. However, there are some marked differences between European countries.
- Swedish banks reduced their lending by over 60% between Q4 2022 and Q2 2023 followed by flat lending in Q3 2023.
- Portuguese and Italian banks continued their CRE lending reductions and since Q4 2019 recorded annual average of -7% and -6% pa, respectively.
- French banks remained most expansionist and increased their CRE lending over the same period by 8% pa. This growth came down to 7% over the last four quarters and 4% in Q3 2023.
- Apart from the lending growth rates, the relative share of CRE lending and CRE share in non-performing loans (NPL) can also be considered.
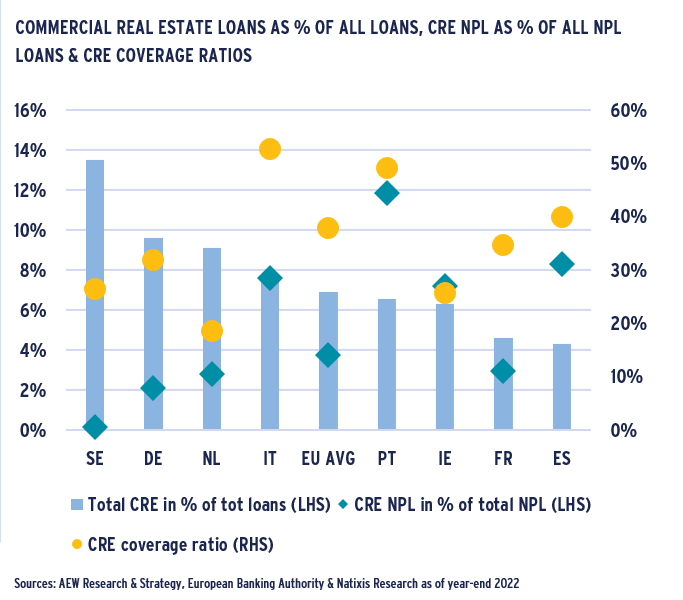
EUROPEAN BANKS REMAIN RESILIENT DESPITE CRE EXPOSURES
- CRE loans make up less than 7% of EU banks’ total lending books and only 4% of their NPL books as of year-end 2022.
- Sweden at 14% CRE loan shares is an outlier on the high end, while Spain and France record only 4% and 5%.
- In comparison, German banks are above the 7% EU average at 10% despite relatively modest 2019-23 growth of 2% pa.
- French, German, Dutch and even Swedish banks record below EU average share of CRE as part of their NPL books.
- Portuguese, Spanish, Italian and Irish banks have well above average CRE shares in NPL books, linked to GFC legacy loans.
- We observe high reserve coverage ratios for banks in countries with high CRE NPL ratios which suggests resilience even for more challenged markets.
- In short, both low CRE NPL and high CRE coverage ratios raise limited concerns for European banks in general.
- European banks seem better capitalised and regulated than pre-GFC. So even if the extent of CRE loan losses are expected to be similar to GFC, their effect on the CRE markets is likely to be less.
This material is intended for information purposes only and does not constitute investment advice or a recommendation. The information and opinions contained in the material have been compiled or arrived at based upon information obtained from sources believed to be reliable, but we do not guarantee its accuracy, completeness or fairness. Opinions expressed reflect prevailing market conditions and are subject to change. Neither this material, nor any of its contents, may be used for any purpose without the consent and knowledge of AEW. There is no assurance that any prediction, projection or forecast will be realized.