
The U.S. economy continues to expand at a moderate pace despite geopolitical uncertainty, trade friction, and renewed inflation pressure. The key story remains the AI-led investment cycle, which is now an important driver of business spending and broader economic activity.
Summary
- Growth remains positive, but uneven. Real GDP grew at a 1.5% annualized rate in Q2, supported by solid consumption and continued AI-related capital spending, even as trade and inventory effects weighed on headline growth.
- Labor availability is becoming the bigger constraint. Job growth has reaccelerated modestly in 2026, but labor force growth has turned negative in five of the past six months and participation has fallen from 62.8% at year-end 2023 to 61.5% in June.
- Inflation and rates remain the main macro headwinds. Inflation has reaccelerated with energy shocks tied to the Iran conflict, real yields have moved higher, and the 30-year Treasury yield ended July at its highest level in twenty years.
- Commercial real estate fundamentals remain generally resilient. NPI total returns have been positive for eight consecutive quarters, driven primarily by income rather than appreciation, while most sectors are still expected to generate moderate positive NOI growth over the next three to five years.
- In this environment, fundamentals matter more. With rates likely to stay higher for longer, income growth, capital discipline, sector selection, and market-level differentiation should matter more than cap rate compression or financial engineering.
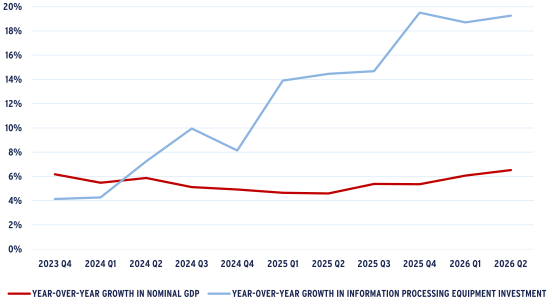
Despite significant headwinds from the on-again, off-again war with Iran, heightened energy market volatility, and renewed trade uncertainty, the U.S. economy continues to expand. Real GDP grew at a 1.5% annualized rate during the second quarter, supported by 3.2% real consumption growth and offset by drags from trade and inventories. The underlying engine of growth remains the outsized AI-driven capex boom at the center of the current late-cycle expansion. This investment continues to increase at an annual rate of nearly 20%, even as investors increasingly question the durability of the cycle.
FIGURE 1: GROWTH IN INFORMATION PROCESSING EQUIPMENT INVESTMENT AND NOMINAL GDP
Source: Bureau of Economic Analysis (BEA)
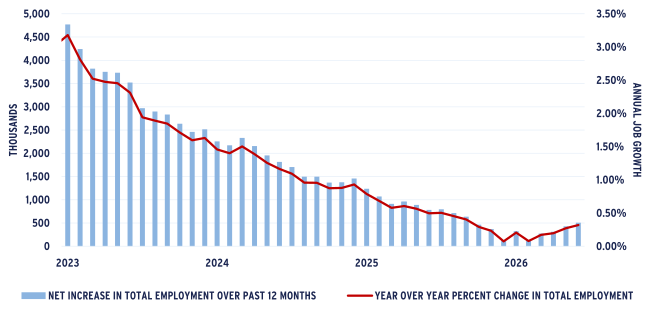
U.S. job growth, which had been slowing for several years, likely bottomed at the end of 2025 with near-zero year-over-year growth and has reaccelerated, albeit moderately, over the first six months of this year.
FIGURE 2: U.S. MONTHLY EMPLOYMENT GROWTH
Source: Bureau of Labor Statistics (BLS), as of June 2026
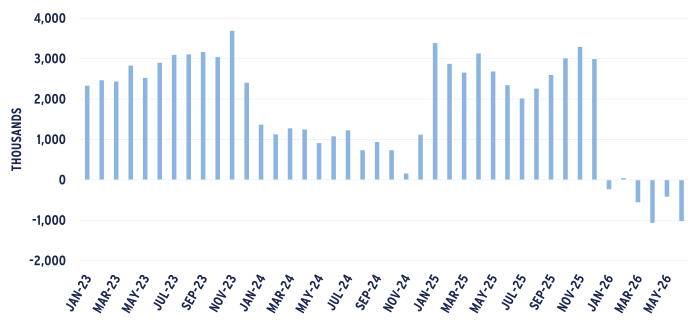
Regardless of employer demand for labor, the greatest constraint on near-term employment growth will likely be labor availability. So far in 2026, the U.S. labor force has recorded negative year-over-year growth in five of the past six months, a phenomenon typically observed only during severe economic events such as the global financial crisis (GFC) or the COVID-19 pandemic.
FIGURE 3: U.S. MONTHLY LABOR FORCE GROWTH (YEAR-OVER-YEAR CHANGE)
Source: Bureau of Labor Statistics (BLS)
Labor force growth, or contraction, is shaped by two factors: changes in the working-age population, typically defined as ages 15 to 64, and the degree to which working-age people choose to participate in the workforce. Current projections from the Census Bureau show little or no growth in the working-age population over this decade as the tail end of the Baby Boom, people currently age 62 to 80, fully exits the labor force over the next several years while the smaller Gen Alpha cohort, people currently under age 16, enters the working-age group. Recent changes to U.S. immigration policy and enforcement likely increase the downside risk to current working-age population growth projections, particularly with respect to foreign-born workers.
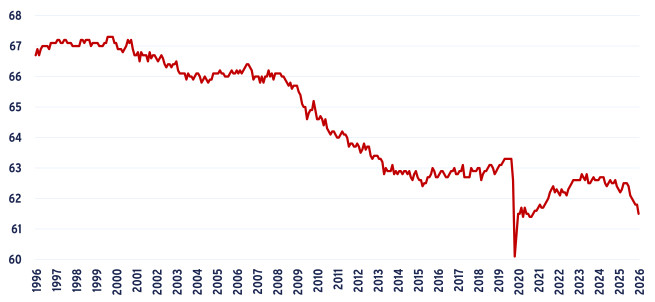
More significantly, U.S. labor force participation rates, while recovered somewhat from the pandemic period, have been falling steadily since the beginning of the century. After reaching a post-pandemic high of 62.8% at the end of 2023, the overall U.S. labor force participation rate declined to 61.5% in June, with the pace of decline accelerating since the beginning of 2025.
FIGURE 4: U.S. LABOR FORCE PARTICIPATION RATE
Source: Bureau of Labor Statistics (BLS), as of June 2026
Left unchanged, current labor force trends are likely to contribute negatively to the larger issue of continued higher inflation. U.S. inflation surged during and immediately after the COVID period, in part reflecting a broad timing mismatch between demand and supply across the economy. In response to fears of collapsing final demand, the U.S. government flooded the economy with direct transfer payments to stimulate consumer and business spending, but increased supply, or production, lagged. The more significant inflationary impact during this period, however, came directly from growth in the money supply as the Federal Reserve monetized government borrowing to facilitate these payments. Between the end of 2019 and the end of 2022, the total U.S. money supply increased approximately 40%, roughly twice the increase in nominal GDP over this period.
FIGURE 5: U.S. MONEY SUPPLY GROWTH AND INFLATION
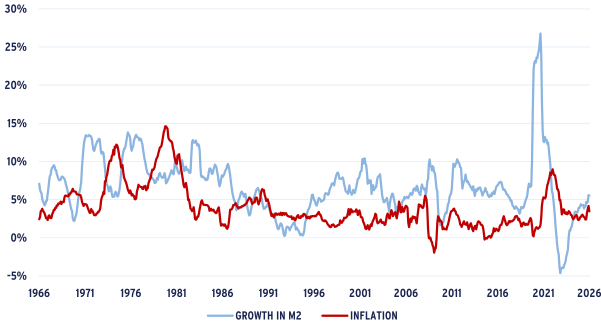
Sources: Federal Reserve, Bureau of Labor Statistics (BLS), as of June 2026
While overall inflation has retreated from post-pandemic highs, it has reaccelerated in recent months in response to energy supply shocks related to the war with Iran. Initially, markets viewed this as a temporary phenomenon, likely to fade as the expected “brief” war concluded. As the war enters its sixth month, markets continue to reassess the temporary nature of the conflict and its impacts on energy prices and broader inflation. To this point, since the day before the war began, February 27, U.S. real yields have moved steadily higher, increasing by roughly 70 basis points and accelerating since mid-May.
FIGURE 6: INFLATION-INDEXED 10-YEAR YIELD
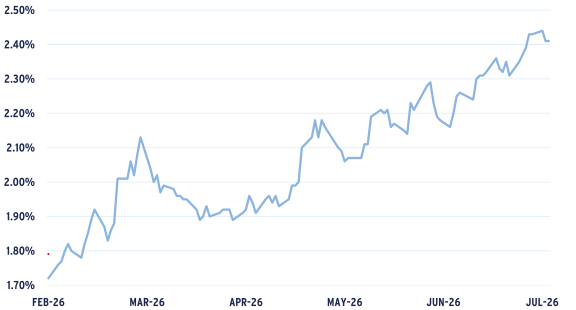
Source: Treasury.gov
Currently, we do not anticipate a near-term interest rate reduction by the Federal Reserve or any meaningful decline in longer rates. To this point, the yield on the 30-year U.S. Treasury bond finished July at the highest level in twenty years, rising above the high watermark of the post-pandemic inflation spike.
FIGURE 7: 30 YEAR TREASURY BOND YIELD
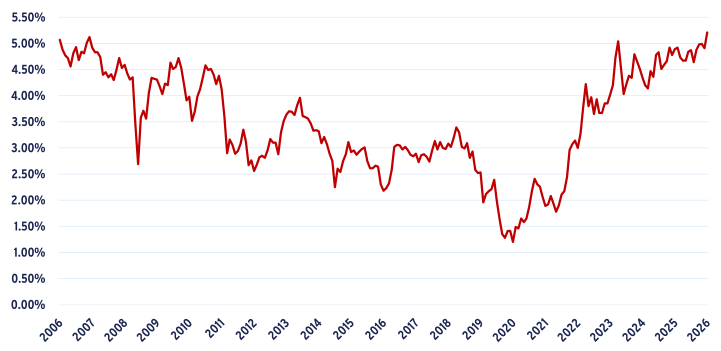
Source: Treasury.gov, as of June 2026
Outlook for U.S. Commercial Property Investment
For commercial real estate investors, the macro backdrop remains generally supportive for property market fundamentals, with continued economic expansion, stable employment, improving productivity, and healthy corporate profits. At the same time, interest rates are likely to remain higher for longer than many investors anticipated, delaying a more meaningful easing in capital markets conditions and limiting overall property appreciation for some time.
Through Q2, U.S. commercial property, as measured by the NCREIF Property Index (NPI), has posted positive total return for eight consecutive quarters, with all or nearly all of the return coming from income rather than appreciation. Over this eight-quarter period, the NPI Capital Value Index is down slightly owing to negative appreciation during the last two quarters of 2024. Since year-end 2024, the NPI Capital Value Index has risen just 42 basis points in total.
FIGURE 8: NPI TOTAL AND INCOME RETURN BY QUARTER
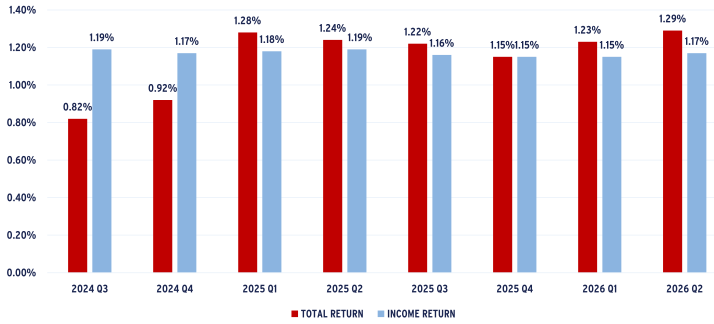
Source: NCREIF
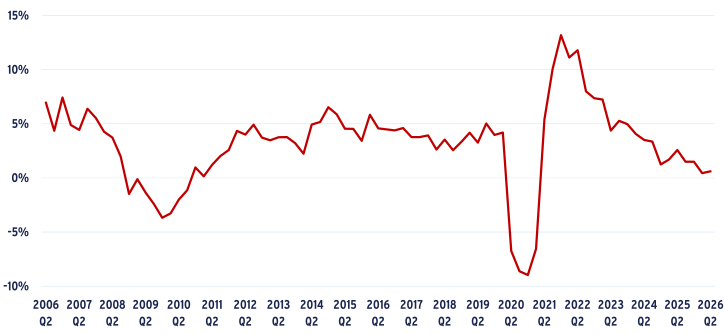
In part, limited recent capital appreciation reflects slowing growth in net operating income (NOI). For the NCREIF universe, year-over-year growth in property NOI has slowed steadily over the past several years, though not evenly across property sectors. As of the second quarter, trailing four-quarter growth in NOI ranged from a low of -5% for office properties to more than +15% for seniors housing. Current forecasts from Green Street (and others) suggest moderate but positive property sector NOI growth over the next three to five years. While there are outliers to both the positive side, including seniors housing, and the negative side, including life science, the near-term outlook for most property sectors is roughly 3% to 4% average annual NOI growth, assuming the broader economy performs as expected.
FIGURE 9: YEAR-OVER-YEAR GROWTH IN PROPERTY NET OPERATING INCOME (NOI)
Source: NCREIF
NOI growth considerations aside, the primary challenge for property investors remains the interest rate environment. Put simply, rates are higher than had been expected and, more significantly, are expected to remain higher in response to higher-than-expected inflation and growing investor concerns over the size and trajectory of the U.S. federal budget deficit.
For commercial real estate, this suggests:
- Cap rate compression, if any, is likely to be further in the future and gradual rather than dramatic.
- Debt costs should remain elevated relative to both earlier periods and, importantly, property income yields.
- Property fundamentals (NOI growth) will matter more than financial engineering.
- Sectors with durable NOI growth should continue to outperform.
The Bottom Line
While the next several years are likely to remain volatile, the setup for commercial real estate continues to improve. Capital markets may take longer to normalize, but property-level fundamentals remain intact, and income return is again doing the heavy lifting. While the near-term NOI growth outlook remains somewhat range bound across sectors, productivity gains from AI-driven investment should ultimately create meaningful differences in growth across markets and sectors. For disciplined long-term investors, that is a constructive environment. The opportunity is not simply to wait for rates to fall, but to focus capital where durable income growth and market selection can drive attractive risk-adjusted returns.
Office
Office market fundamentals continued to stabilize during the second quarter, although momentum remains concentrated within a limited number of metropolitan areas. While tenant activity has expanded modestly, labor-market softness continues to temper the pace of improvement, shown through slower hiring and ongoing uncertainty surrounding long-term workplace utilization. Encouragingly, leasing activity is increasingly reaching assets beyond the newest and most competitive buildings. Net absorption in properties more than a decade old remained positive after turning positive late last year for the first time since 20181, suggesting that recent leasing trends indicate that activity is no longer confined to a limited group of properties. While transaction activity has strengthened, overall leasing volumes remain below the levels commonly achieved during the pre-pandemic expansion. New York continues to occupy a leadership position among major office markets, supported by some of the strongest workplace utilization metrics nationally and continued tenant activity from the finance sector. San Francisco has also demonstrated renewed momentum, posting one of the strongest occupancy recoveries among large U.S. markets over the past year. Despite these improvements, the sector faces an increasingly complex outlook as structural reductions in supply offset only part of the longer-term headwinds associated with demographic and workplace shifts.
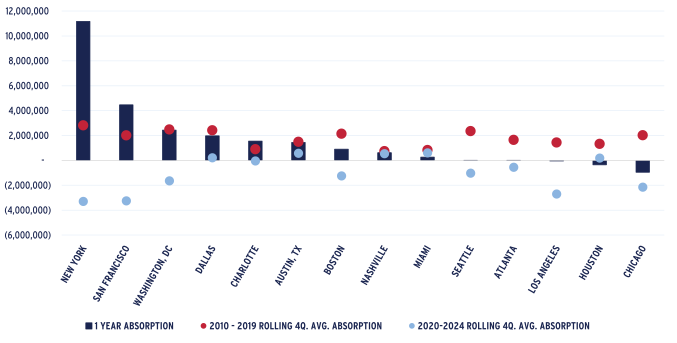
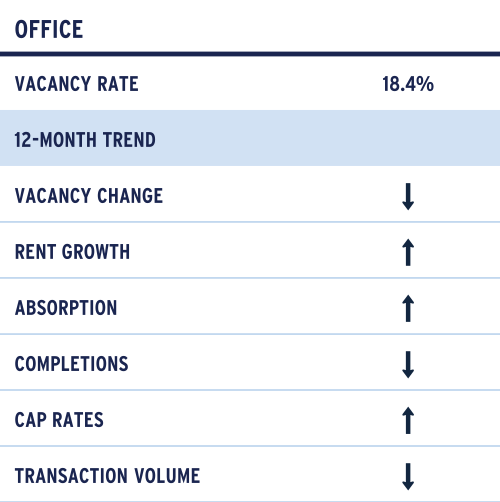
Occupier demand strengthened further during the first half of 2026. According to CBRE, annual net absorption has recovered from approximately one-third of pre-pandemic norms to more than 80% of the average annual pace recorded between 2010 and 2019. More than 11 million square feet were absorbed during the second quarter alone, equal to the combined total recorded over the prior two quarters. Stronger space utilization trends, combined with minimal additions to competitive inventory, helped push national vacancy lower, which declined to 18.4% after peaking at 19.1% in mid-2024. Current demand levels are now broadly aligned with historical quarterly absorption patterns, representing a notable improvement from conditions observed over the past several years.
Corporate real estate strategies continue to evolve as organizations seek to balance attendance requirements with cost and efficiency objectives. Lease expirations, footprint optimization efforts, and organizational restructuring remain common, limiting substantial growth in occupied square footage despite healthier leasing activity. Market performance continues to vary widely. New York and San Francisco are the only major office markets to have generated at least five consecutive quarters of occupancy growth, while many gateway markets continue to work through elevated vacancy and tenant downsizing. On a trailing 12-month basis, Washington, D.C. has largely regained its pre-pandemic demand profile, while annual absorption in San Francisco has climbed to more than twice its historical norm. At the same time, the lasting impact of technological advancements, including AI-enabled productivity gains, and how these trends ultimately affect space utilization remains an open question.
Differences in market performance remain pronounced across the nation's largest office centers. New York and San Francisco substantially outperformed historical demand benchmarks over the past year, while Boston, Dallas, and Washington, D.C. posted results broadly consistent with longer-term averages. Conversely, Los Angeles, Houston, and Chicago continued to record net occupancy losses. Nevertheless, each major market has improved relative to its average performance during the post-pandemic period. These outcomes reinforce the increasingly localized nature of office demand, where economic specialization, tenant composition, and return-to-office adoption rates are exerting greater influence on market trajectories than broad national trends.
FIGURE 10: ANNUAL VS. LONG-TERM AVERAGE ABSORPTION
Source: CBRE-EA 2026 Q2
Occupiers remain focused on maximizing space productivity via flexibility, operational efficiency, and space optimization. Although leasing activity has accelerated, leasing requirements continue to come in meaningfully smaller than long-term averages, with transaction sizes tracking roughly 15% below historical levels. This trend is expected to persist as companies continue adapting workplace strategies and reassessing future utilization requirements. Labor market conditions also remain a key variable. Employment in major office-using industries remains roughly 675,000 positions below the April 2023 peak2, although recent readings indicate the pace of contraction has moderated. Longer-term forecasts continue to call for modest expansion, with annual employment growth expected to average approximately 0.2% to 0.3% through the remainder of the decade.
Transaction market conditions improved further during the quarter. Bid-ask spreads have narrowed, transaction volume has improved, and market participants have established firmer benchmarks for asset values. Distressed and underperforming assets continue to account for a meaningful share of transaction activity, while investors have shown increasing willingness to acquire assets at repriced valuations. However, the divide between competitive, well-positioned buildings and functionally obsolete stock remains significant. As a result, redevelopment, adaptive reuse, and demolition activity continue to play an important role in shaping inventory levels. According to CoStar, approximately 55 million square feet of office space was completed during 2025, while more than 40 million square feet was removed from inventory. Against this backdrop, NCREIF's value-weighted office cap rate index declined to 5.7% in the second quarter from 5.9% one year earlier, reflecting improving confidence in portions of the investment market.
Taken together, recent data suggest that office fundamentals are improving at a measured pace. Vacancy continues to edge downward, leasing activity has strengthened relative to recent years, and limited inventory growth is providing support to market conditions. While market performance remains uneven and questions around future space utilization persist, occupier demand has become less concentrated than earlier in the recovery. As a result, the sector appears positioned for continued, albeit gradual, improvement through the balance of 2026.
Apartment
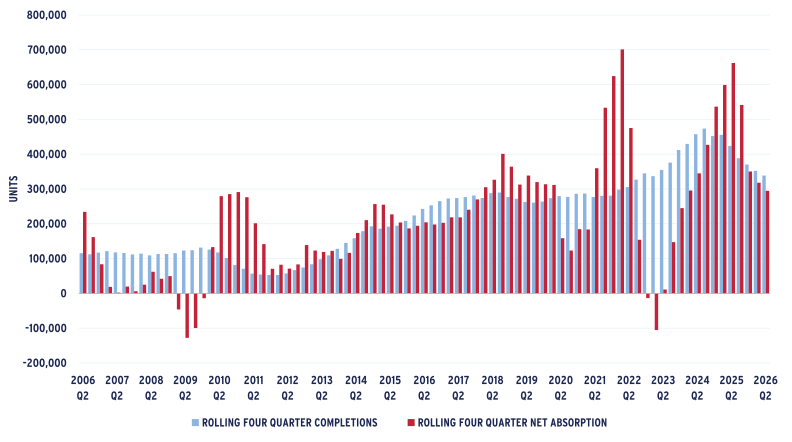
U.S. apartment fundamentals continued to stabilize in the second quarter of 2026 as the sector moved further beyond the peak supply pressures of 2023–2024. Following an unprecedented development cycle that peaked with more than 450,000 units delivered in 2024, annual completions declined to roughly 369,000 units in 2025, an 18% decrease. Total U.S. apartment inventory reached approximately 18.4 million units as of Q2 2026, reflecting 1.9% year-over-year growth. While performance remains uneven across markets, the slowdown in deliveries is beginning to improve the supply-demand balance. Through Q2 2026, completions totaled approximately 142,000 units, down 18.2% from the first half of 2025, while net absorption was approximately 252,000 units.
U.S. Apartment Vacancy Rate & Rent Growth
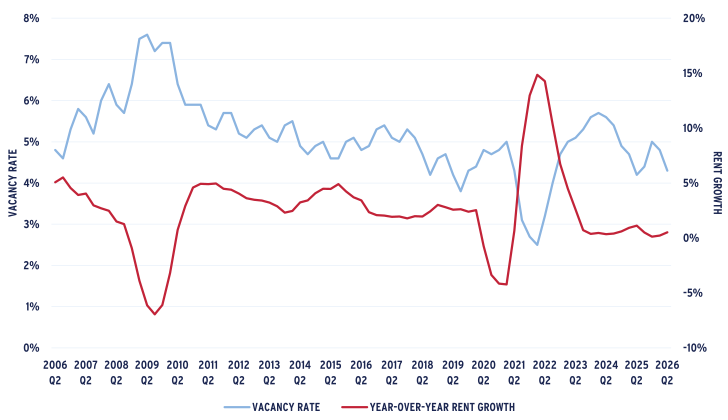
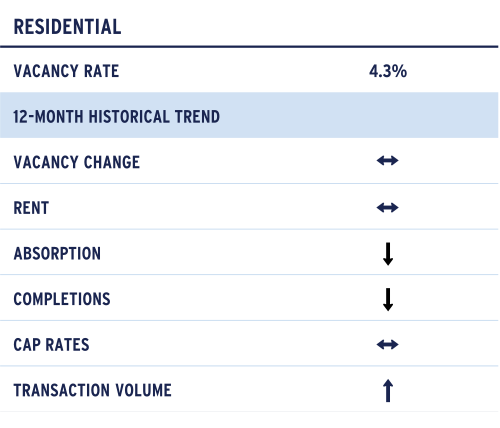
National vacancy declined to approximately 4.3% in Q2 2026, down 50 basis points from Q1 2026 and 70 basis points from the recent Q4 2025 peak. Vacancy was broadly in line with the 4.2% rate recorded in Q2 2025, suggesting that the earlier vacancy expansion has largely stabilized at the national level. Net absorption totaled approximately 252,000 units year to date, ahead of the roughly 142,000 units of new deliveries. By comparison, first-half 2025 absorption totaled approximately 308,000 units against 174,000 units of completions. This means both demand and new supply have moderated year-over- year, but absorption continues to exceed deliveries in 2026. Rent growth remained subdued but improved modestly in Q2. Average monthly rent per unit nationally reached approximately $2,257, up 0.5% year-over-year and 1.5% quarter-over-quarter. Revenue per unit increased to approximately $2,159, up 0.3% year-over-year and 2.1% quarter-over-quarter, consistent with stabilizing occupancy but still-limited pricing power following the elevated supply cycle.
FIGURE 11: U.S. APARTMENT VACANCY AND RENT GROWTH
Source: CBRE-EA 2026 Q2
Demand-side conditions remain supportive but have normalized from prior-cycle extremes. Net absorption peaked at more than 624,000 units in 2021, was slightly negative in 2022, rebounded to approximately 245,000 units in 2023 and 537,000 units in 2024, and then moderated to 350,000 units in 2025. Through Q2 2026, absorption is running approximately 18.1% below first-half 2025 levels, consistent with late-cycle normalization rather than structural demand weakness.
FIGURE 12: U.S. APARTMENT SUPPLY & DEMAND
Source: CBRE-EA, 2026 Q2
The most meaningful shift in the apartment market continues to occur on the supply side. Annual completions declined by approximately 18% year-over-year in 2025, and first-half 2026 deliveries are down a further 18.2% from the first half of 2025. On a rolling four-quarter basis, completions declined to approximately 339,000 units as of Q2 2026, while rolling four-quarter absorption totaled approximately 295,000 units. New construction remains below recent peaks, constrained by elevated financing costs and tighter lending standards, while demand continues to normalize toward pre-pandemic levels.
While new supply is moderating in aggregate, pockets of development remain. In particular, southern markets such as Richmond, Charlotte and Raleigh, along with Salt Lake City, will likely experience a longer period of new-unit pressure on occupancy and rents as the current supply cycle abates over the next 12 to 24 months.
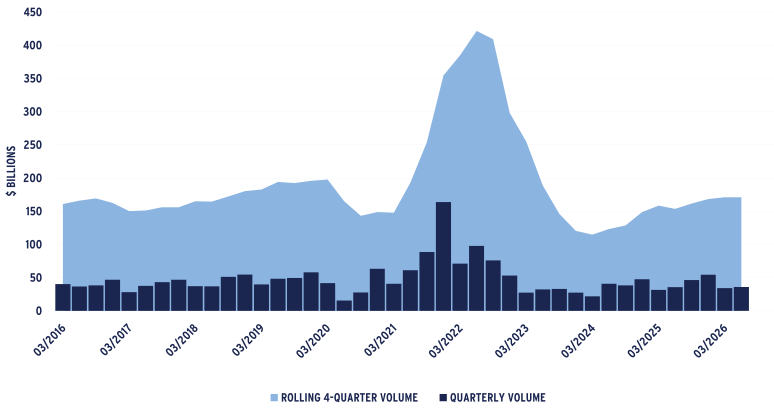
Capital markets conditions for apartments remain challenging but are showing clear signs of stabilization. Rolling four-quarter multifamily transaction volume totaled more than $171 billion as of Q2 2026, still more than 50% below the $350 billion to $420 billion annualized peak recorded during 2021–2022.
Multifamily Sales Volume – Q2 2026, RCA
Looking ahead, the near-term outlook for the apartment sector remains cautious but increasingly constructive. With completions continuing to decline and net absorption remaining positive, vacancy should remain stable to modestly lower if demand continues to outpace deliveries. Rent growth should recover gradually into the low single digits as competitive pressures ease, though outcomes will remain uneven across regions. Oversupplied Sun Belt markets are likely to lag the recovery, while supply-constrained and structurally resilient markets should tighten more quickly.
FIGURE 13: U.S. APARTMENT TRANSACTION VOLUME
Source: RCA/MSCI 2026 Q2
Overall, the U.S. apartment market at mid-2026 appears to be in the latter stages of bottoming. While near-term softness persists in select metros still digesting elevated deliveries, year-over-year trends across supply, vacancy and absorption increasingly point toward stabilization. For investors and owners, the focus remains on income durability and execution in the near-term, with improving fundamentals expected to support stronger performance into 2027.
Industrial
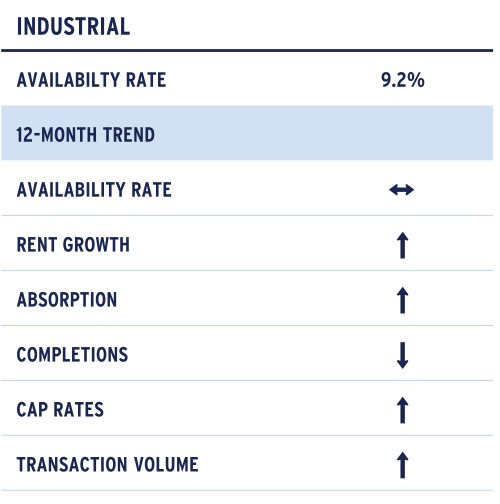
U.S. industrial fundamentals continued to stabilize in the second quarter of 2026 as the sector moved further beyond the oversupply pressures that characterized the prior two years. The imbalance between supply and demand continued to narrow, suggesting the market is progressing through the later stages of its correction and toward a more balanced operating environment. Total U.S. industrial stock reached approximately 16.8 billion sf in the quarter, an increase of 1.3% from Q2 2025.
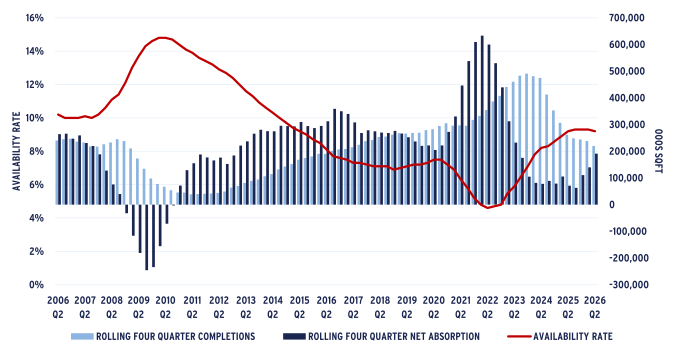
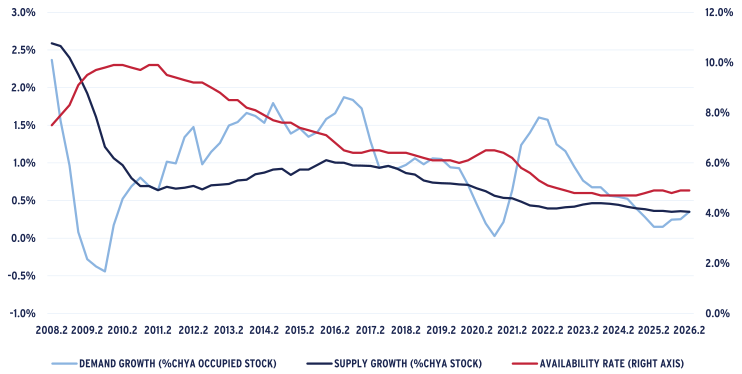
A key contributor to improving conditions is the continued downshift in new deliveries. Annual completions peaked at approximately 491 million square feet (msf) in 2023 before declining to roughly 244 msf in 2025, an overall decline of nearly 50%. National availability ticked down slightly in Q2 2026, though it remains elevated relative to recent history. Availability registered 9.2% in Q2 2026, flat from one year ago and down 10 basis points (bps) from Q1 2026, reflecting an environment that is no longer deteriorating rapidly but one that still provides tenants with meaningful leverage in many markets. Demand improved materially year-over-year, with approximately 47.4 msf absorbed in Q2 2026 compared with negative 3.5 msf in Q2 2025. While encouraging, aggregate net absorption remains well below the peak levels recorded in 2021 and 2022.
FIGURE 14: U.S. INDUSTRIAL SUPPLY, DEMAND & AVAILABILITY RATE
Source: CBRE-EA 2026 Q2
Rent growth remained subdued overall, though headline asking metrics point to modest upward pressure rather than broad acceleration. Average gross asking rents rose approximately 3.2% year-over-year, from $12.94 psf in Q2 2025 to $13.36 psf in Q2 2026. Average effective asking rents increased more modestly, from $10.95 psf in Q2 2025 to $11.08 psf in Q2 2026, consistent with a market where concessions and competitive lease-up dynamics continue to limit effective pricing power.
Demand fundamentals remain constructive, albeit at a more normalized pace than the extraordinary levels recorded earlier in the cycle. Slower economic growth, softer trade activity and more measured goods consumption have tempered warehouse leasing relative to the historic highs observed in 2021 and 2022. Nevertheless, secular demand drivers including the AI cap ex investment boom, e-commerce expansion, third-party logistics growth, inventory optimization strategies and ongoing manufacturing reshoring initiatives continue to support positive net absorption across the sector.
Logistics cost pressures remain an important watch item for the industrial outlook, particularly as continued instability around the Strait of Hormuz has contributed to higher diesel costs, diesel-linked surcharges and more volatile freight pricing. Even absent sustained physical supply interruptions, elevated fuel, shipping and transportation costs can pressure occupier margins, influence landed-cost calculations and shape distribution-network decisions, encouraging tighter routing, greater emphasis on efficiency and, in some cases, higher inventory buffering closer to end markets. Tariffs remain an additional, though comparatively secondary, source of cost uncertainty for import-oriented users. For owners, these pressures can modestly dampen demand for far-flung, purely cost-driven distribution locations where fuel costs weigh more heavily on total occupancy economics, while reinforcing the relative attractiveness of infill, port-proximate and population-adjacent assets that shorten delivery times, reduce transportation volatility and help tenants better manage pricing pressure.
The most meaningful shift continues to occur on the supply side. The development pipeline has contracted substantially and deliveries are now receding from their 2022-2023 peak period. That supply downshift is visible in both annual delivery trends and the quarterly data, with completions falling 33% year-over-year in the second quarter. While availability remains elevated by historical standards, the market is increasingly working through the excess space delivered during the recent development surge. The modest decline in availability to 9.2% in Q2 2026 from 9.3% in Q1 represents another encouraging sign that supply-demand conditions are gradually rebalancing.
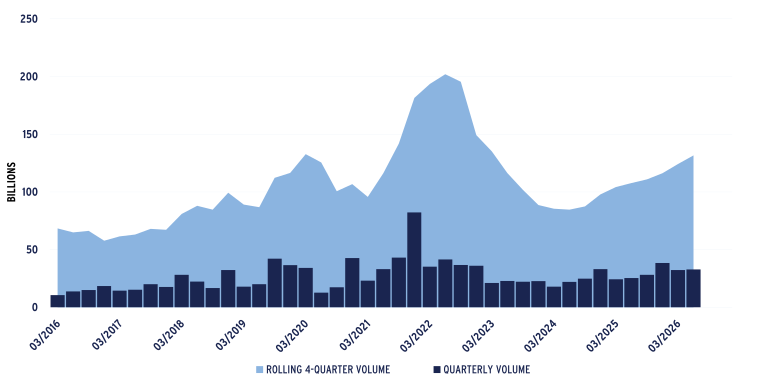
Capital markets activity continued to recover in Q2 2026, supported by improving investor sentiment and greater transaction liquidity. According to RCA, U.S. industrial sales volume reached approximately $32.8 billion during the quarter, representing a 29.2% increase year-over-year from Q2 2025. On a rolling four-quarter basis, transaction volume climbed to $131.6 billion, up from $107.6 billion one year earlier and the highest level recorded since late 2022. Property-level transaction activity also strengthened, with roughly more than 2,500 industrial assets trading during the quarter compared with 2,125 assets in Q2 2025. While price discovery remains ongoing in some segments, the steady rebound in transaction volume suggests capital is increasingly returning to the sector as concerns surrounding interest rates, valuation adjustments and market uncertainty continue to moderate.
FIGURE 15: INDUSTRIAL SALES VOLUME – Q2 2026
Source: RCA
Looking ahead, the near-term outlook continues to point toward a gradual value recovery. With development activity slowing materially and net absorption remaining positive, availability should improve incrementally over the coming quarters and rent growth should firm modestly. Performance is likely to remain uneven across markets and property segments, with oversupplied big-box markets lagging the recovery while supply-constrained, infill and strategically located markets tighten more quickly. Overall, the U.S. industrial market in mid-2026 appears to be in the later stages of bottoming. While some softness persists in select metros still digesting recent deliveries, the improving supply backdrop and durable underlying demand drivers position the sector for a gradual recovery into 2027.
Retail
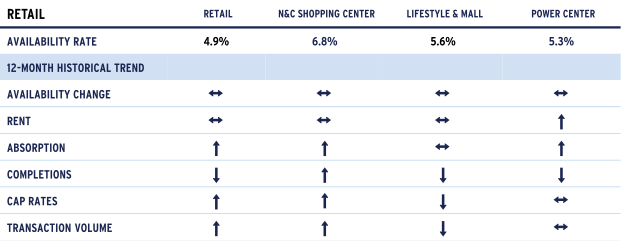
Retail fundamentals changed little during the second quarter, reflecting a market that remains undersupplied despite softer demand growth than in recent years. National availability held at 4.9%, essentially unchanged from prevailing levels over the past year. Although availability has edged up from its lows, retail space remains scarce relative to long-term averages, with occupancy demand continuing to absorb most new inventory entering the market.
FIGURE 16: RETAIL FUNDAMENTALS
Source: CBRE-EA 2026 Q2
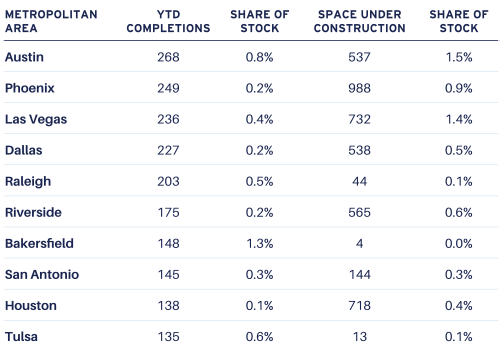
Limited supply-side pressures remain a defining feature of the market. New construction totaled 5.7 msf during the quarter, bringing trailing 12-month completions to 28.5 msf. That total is below the 29.5 msf delivered during the prior 12-month period and remains less than half the pre-pandemic annual average of nearly 62 msf3. As a result, U.S. retail inventory increased only 0.3% year-over-year, underscoring the constrained pace of development. Development activity remains muted across most major markets, with construction volumes hovering near historic lows as developers contend with elevated construction costs, tighter financing conditions, and ongoing tariff-related uncertainty.
TABLE 1: TOP TEN MARKETS BY YTD COMPLETIONS
Source: CBRE-EA, 2026 Q2
New retail investment remains highly selective. Most projects underway involve tenant-committed developments, grocery-led centers, or site-specific expansion opportunities tied to demonstrated demand. Rather than materially expanding inventory, new construction is largely aimed at modernizing existing retail districts and improving merchandising options within established trade areas. Again, elevated interest rates, higher and less certain construction costs, and lengthy entitlement processes continue to restrain new starts, helping keep near-term supply growth in check. As a result, speculative development remains limited, with new projects largely concentrated in markets where demand is well established, particularly high-growth suburban corridors and top-performing retail nodes.
Against this backdrop of limited supply, tenant demand remained healthy, though below the unusually strong pace recorded at the end of 2025. Net absorption totaled 5.0 million square feet in the second quarter, roughly double the first-quarter pace but still only about one-third of the level recorded in late 20254. While absorption remains below the elevated levels achieved during the immediate post-pandemic period, it represents an improvement from year-ago results, which were net negative. Leasing professionals continue to report strong backfill activity in previously occupied space, particularly within dominant centers and established retail destinations.
Leasing activity continues to provide an important source of support for market fundamentals. Landlords continue to report multiple prospective tenants competing for well-positioned vacancies, particularly among service-oriented, fitness, discount, and quick-service retail operators, while smaller-format space remains especially constrained. Although availability within larger-box formats has shown greater quarter-to-quarter variability, lease-up timelines remain near historic lows, highlighting continued tenant demand for well-located space.
Despite modest tightening in market conditions, rent growth remains subdued at 2.1%, near the post-recovery lows reached in the first quarter of 20215, providing tenants with greater negotiating leverage. At the same time, years of limited construction continue to provide an important cushion against potential weakness in market conditions, even as rent gains remain muted. Year-over-year rent growth has been relatively stable over the past six quarters, reflecting a normalization from the outsized increases recorded during the prior three-year period. While growth accelerated modestly this quarter, it remains well below the peaks reached during that earlier cycle. Regional performance continues to vary, with Southern markets generally posting stronger rent growth while Western markets lag.
Taken together, second-quarter results suggest that retail fundamentals remain resilient despite slower growth than in recent years. Availability remains near historic lows, construction activity is limited, and tenant demand continues to support occupancy across most formats. While market conditions are no longer tightening at the pace seen earlier in the cycle, the combination of constrained supply and ongoing retailer expansion should support healthy operating performance through year-end 2026.
1 CoStar National Office Report 2026Q1
2 CoStar National Office Report
3 CBRE-EA Total Retail Market History 2Q2026
4 CBRE-EA Total Retail Market Fundamentals History 2Q2026
5 CBRE-EA Total Retail Market Fundamentals History 2Q2026
For more information, please contact:
MICHAEL ACTON, CFA®
Managing Director, Head of Research & Strategy, North America
michael.acton@aew.com
+1.617.261.9577
JAY STRUZZIERY, CFA®
Head of Investor Relations
jay.struzziery@aew.com
+1.617.261.9326
This material is intended for information purposes only and does not constitute investment advice or a recommendation. The information and opinions contained in the material have been compiled or arrived at based upon information obtained from sources believed to be reliable, but we do not guarantee its accuracy, completeness or fairness. Opinions expressed reflect prevailing market conditions and are subject to change. Neither this material, nor any of its contents, may be used for any purpose without the consent and knowledge of AEW. There is no assurance that any prediction, projection or forecast will be realized.