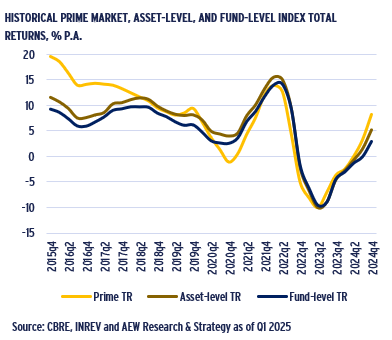
- The strong long-term correlation between our usual European prime market returns and European fund-level returns provides a solid basis for testing whether we can use prime market returns to project fund returns.
- CBRE’s prime returns are based on yields and rents, assuming the best asset in the best location for each of 196 markets. The INREV fund-level returns reflect realised returns from European fund portfolios reporting to INREV.
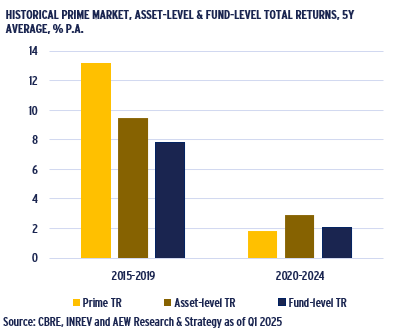
- The relationship between prime market and fund-level returns has varied over time. Prime market returns exceeded fund-level returns in 2015-19, while prime returns trailed fund-level returns in the 2020-24 period.
- To align them as closely as possible, we reconcile prime market returns with fund-level returns by: (1) reweighting the prime markets according to INREV fund index weights per country and sector; (2) accounting for property expenses; (3) incorporating fund vehicle costs; and (4) quantifying the impact of leverage.
- However, this leaves a residual that ranges from -140bps to +60bps between prime market and fund-level returns based on different historical periods. This residual arises because synthetic prime returns do not fully capture the unique asset-level risks, asset and fund management as well as timing of acquisition and disposals.
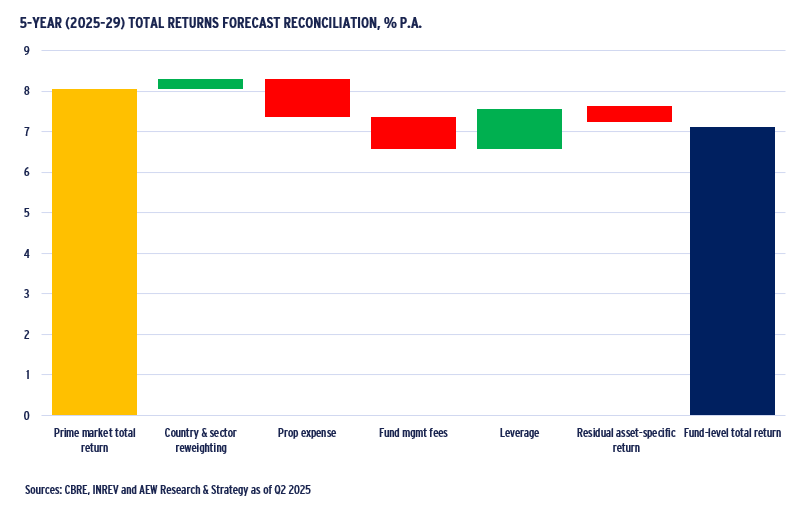
- Therefore, we assume a -40bps negative impact for future returns based on the range of historical unique asset-level risks. As shown in the chart, our projected 2025-29 INREV fund level returns are 7.1% p.a. compared to 8.1% p.a. for our prime markets, implying a 100bps return gap.
- Asset quality does not fully explain the residual difference. Despite the fact that CBRE’s prime (high asset quality) returns exceeded Green Street non-prime (average asset quality) returns during both the 2015-19 and post-COVID 2020-24 periods, the 2025-29 forecasts actually show lower prime than non-prime returns.
- Since no fund can acquire only prime market assets all the time, it is logical that fund returns trail (synthetic) prime returns. Reasons to invest in funds remain strong as most investors lack the team or balance sheet capacity to achieve a sufficiently diversified portfolio. Funds can deploy across many markets and actively manage the assets.
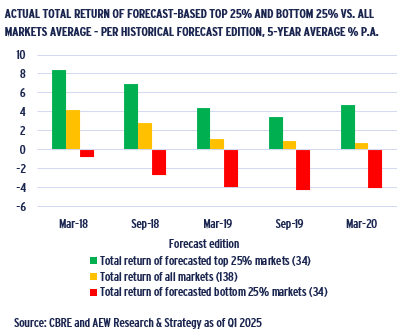
- This brings us to our final question: How useful have past prime market forecasts been? While accurately forecasting yields and returns across European markets has been challenging due to external shocks, our back-testing indicates that the top 25% of our projected markets consistently outperformed the market average.
MAPPING PRIME MARKET RETURNS TO FUND-LEVEL RETURNS
High Correlation in Prime Market and Core Fund Returns Post-GFC
- A frequently asked question from investors in European real estate is what return series is the most useful to use.
- For fund investors, the INREV fund level index is useful as it measures the reported returns from a large universe of funds invested across Europe over a long period of time.
- For asset level investors, both the INREV asset level returns and CBRE prime returns are relevant as neither is leveraged or assumes a fund structure.
- Please note the difference in CBRE Prime and INREV universes: the former covers 196 prime markets and the latter reflects portfolios of INREV index constituting funds.
- Another major difference is the synthetic nature of CBRE returns, derived from prime yield and rent movements, while INREV’s series represent actual realised returns.
- Regardless of this mismatch the long-term correlation between return series is strong, as shown in the graph.
- Therefore, we can test to see whether using prime market forecasts can be used to predict fund-level returns.
Core Fund Returns Exceed Prime Post-COVID
- However, when we consider returns in more detail for recent periods some relevant differences become clear.
- At 13% p.a. prime (market) returns in the pre-Covid 2015-19 period come out well ahead of both asset and fund level returns of 9.5% and 7.8% p.a., respectively.
- However, asset level returns of 2.9% p.a. come out ahead of the 2.1% p.a. fund and 1.8% p.a. prime returns in the most recent 2020-24.
- In this most recent period, interest rate hikes and high inflation widened property yields and pushed down valuations and capital values.
- Low-yield prime returns are more sensitive than funds’ average returns to the same levels of yield widening and therefore suffered more in the recent downturn.
- However, it would be useful to dissect the difference between fund-level and prime returns in more detail.
Hard to Explain Core Fund Returns by Prime Returns
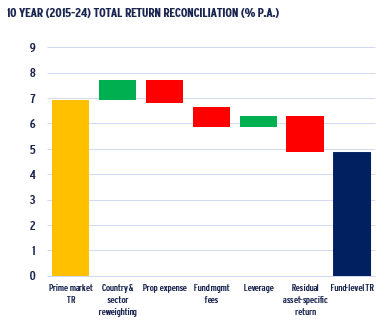
- If we start with our 2015-24 prime returns, we can identify a number of components to reconcile to fund level returns.
- First, we reweight our prime returns with country- and sector-specific weights from the historic INREV fund index composition. This adds 80bps to fund returns.
- Secondly, funds are unable to get reimbursed by tenants for all property expenses and have management fees, which reduces fund returns by further 165 bps combined.
- Thirdly, we consider leverage and use the historically low INREV reported LTV to quantify the impact of leverage, which adds just above 40 bps to fund returns.
- Finally, this leaves a -140bps residual between prime market and fund returns in 2015-24.
- However, the residual has not been stable and, in fact, was positive at +60 bps for the more recent 2020-24 period.
- This residual arises because synthetic prime returns do not fully capture the unique asset-level risks, asset and fund management as well as timing of acquisition and disposals.
Fund Returns Include Irrecoverable Property Expenses
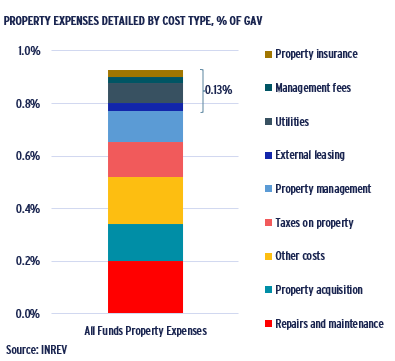
- Synthetic prime market-level returns do not take into account property or fund-level expenses as they are reflective of headline prime rents and yields.
- INREV reports irrecoverable property expenses as a share of gross asset value (GAV) and the most recent data shows them at 93 bps.
- Some of the biggest components of these expenses are repairs & maintenance, acquisition costs, property taxes as well as property management and leasing agent fees.
- Some of these expenses (like acquisition & leasing) could be higher for core-plus and value- add funds, which are included in the INREV fund-level index returns.
- The size of fund by GAV will also have an impact on the share of these costs, as some service contracts should allow for economies of scale to benefit bigger funds.
Vehicle Costs Also Impact Fund Returns
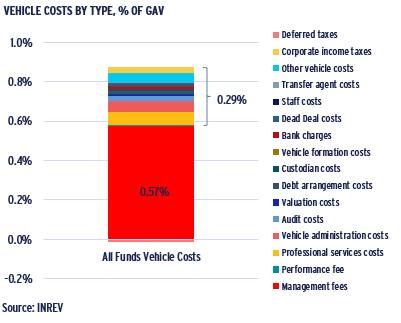
- Vehicle costs are a net cost for the investors in a fund, consisting of a wide range of different components, as shown in the chart.
- INREV has been reporting these as a share of gross asset value (GAV) and the most recent data shows them at 79 bps.
- Some of the biggest components of these costs are fund management fees at 57 bps and a wide range of fund-related legal, tax and administrative costs totaling 29 bps.
- Some of these costs are part of the J-curve effect for newly launched funds, as many set-up costs are front loaded and will remain a drag on returns until diluted as the fund grows.
- The size of fund by GAV will also have an impact on the share of these costs, implying that the median fund vehicle cost ratio could exceed the average of 79 bps.
- Deferred or latent capital gains taxes might be reported in various manners depending on local accounting rules and fund structure as well as investor tax status.
2025-29 Fund Returns Projected To Reach 7.1% P.A.
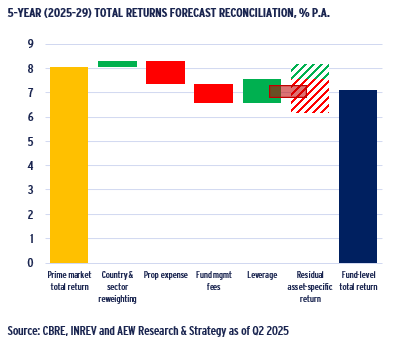
- First, to project fund level returns, we reweight country and sector segments, which adds nearly 25 bps to fund returns.
- Secondly, we assume that funds will still face a 165 bps drag from unreimbursed expenses and management fees.
- Thirdly, we consider leverage and use the most recent INREV reported LTV to quantify the impact of leverage, which adds nearly 100bps to projected fund returns.
- We assume a -40bps negative impact for future returns based on the historical range of –140bps (2015-24) and +60 bps range (2020-24).
- Based on this, our projected 2025-29 INREV fund level returns are 7.1% p.a. compared to 8.1% p.a. for our prime markets, implying a 100bps return gap.
- Fund returns should trail prime returns, since no fund can acquire only prime market assets all the time.
- Reasons to invest in funds remain strong as most investors lack the team or balance sheet capacity to achieve a sufficiently diversified portfolio.
CAN NON-PRIME RETURNS FURTHER EXPLAIN FUND-LEVEL RETURNS?
Stronger Past Prime Rental Growth not Projected to Last
- If prime market returns reflect a higher quality and better located asset compared to what funds are invested in, perhaps non-prime returns can better explain fund returns.
- We compare data and forecasts from the CBRE/AEW prime market with Green Street’s Class B+/B property quality, which may be more consistent with INREV fund assets.
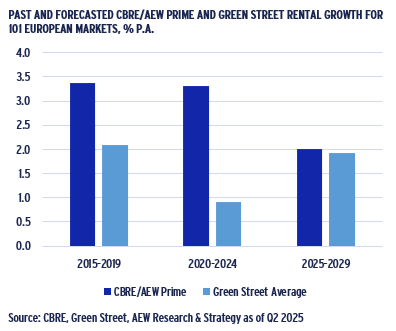
- In the first instance, we compare past and projected rental growth for the 101 market segments available from both, which excludes shopping center markets.
- Prime market rental growth was 130bps and 240bps p.a. higher than non-prime in 2015-19 and 2019-24, respectively.
- This is not expected to continue as 2025-29 rental growth for prime and non-prime are forecasted at 2% p.a.
- Some methodological differences exist; for CBRE's prime rent growth figures, we use prime headline rents, while for Green Street’s figures, we use net rental income growth, as these directly affect their respective value indices.
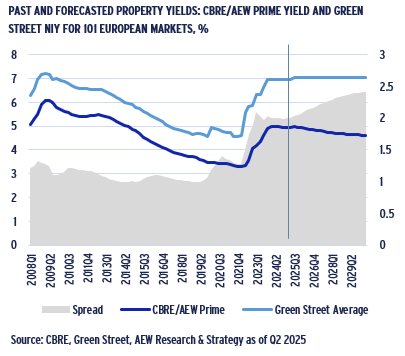
Post-covid Prime Vs Non-prime Yield Spread Doubled
- In our next comparison, we reflect on prime and non-prime yields for the same 101 European markets.
- Over the long term, there is a surprising level of correlation, with a relatively stable 100 bps excess spread between high yielding non-prime and lower yielding prime markets.
- However, this consistency starts to break down in the post-COVID period, as the excess spread rises above 200 basis points from 2023.
- Going forward, given that our bespoke AEW yield projections show some tightening in prime, while Green Street is projecting flat yields, the difference increases.
- This is triggered by differing convictions about sectoral yield movements; for example, in offices, where Green Street expects flat yields while AEW anticipates some compression.
- Given these yield projections and rental growth forecasts, we can derive and compare total return projections as well.
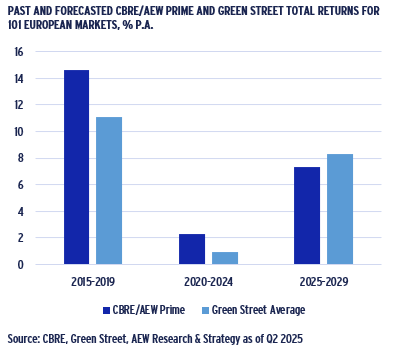
Past Prime Outperformance not Expected in the Future
- Total returns are estimated using both rental growth and yields for prime and non-prime European markets.
- Over the past 10 years, prime returns have exceeded non-prime returns in both the 2015-2019 and post-COVID 2020-2024 periods by 3.5% and 1.4% p.a., respectively.
- This pattern, however, is not anticipated in the forecasts, even though the spread between prime and non-prime yields is expected to increase.
- Higher income returns more than cancel out the effect of the widening spread over prime, resulting in a projected excess non-prime return of 1.0% p.a. for 20-2029.
- Asset quality, therefore, does not fully explain the residual difference between prime and fund returns.
- The residual arises because synthetic returns do not fully capture the unique asset-level risks, asset and fund management or timing of acquisition and disposals.
- This leads to our final question: How useful have our past prime forecasts been?
HOW USEFUL HAVE PRIME FORECASTS BEEN?
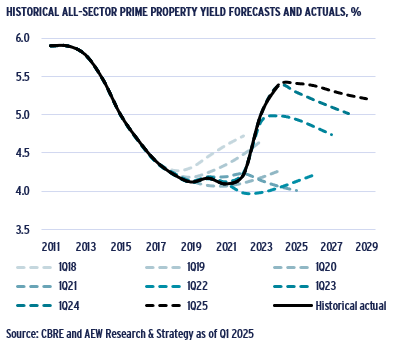
Covid and Rate Shocks Triggered Prime Yield Forecast Changes
- Yields have been the main driver of volatility in prime total returns over the past 10 years. On the graph, historical data is from CBRE, while forecasts are bespoke to AEW.
- The chart indicates how past forecasts (dashed) have differed from actual yields across the 138 market segments consistently available for the period.
- Getting the timing right for yield turning points has proven to be difficult in both the upturn and downturn cycles.
- In 2018-20, we predicted widening that did not materialize, while our 2021 projections indicated potential tightening that did not occur.
- The 2022-23 predictions underestimated the widening.
- More recent forecasts of 2024-25 have shown yields peaking and tightening, which has now begun to occur.
- These results are similar to what was observed in the bond markets, as consensus surveys missed turning points.
- Our past rent forecasts were less problematic, as they tend to revert to long-term trend growth, which is not far from actual growth.
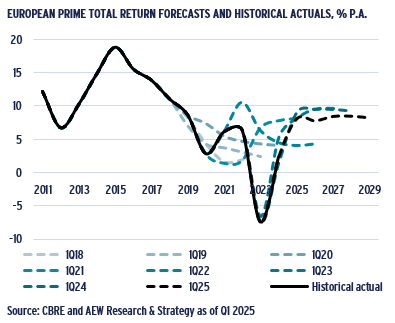
External Shocks Limit Accuracy of Return Projections
- Our 2018-20 historical total return forecasts, for which we have actual results, indicated more optimistic returns than the data ultimately confirmed.
- However, this is true for many other asset classes, as external shocks such as COVID-19 and the wars in Ukraine and the Middle East triggered significant inflation and rate hikes.
- Our 2018-21 forecasts did not anticipate the depth of the adjustment actually recorded in 2022-24, primarily because our yield projections were slow to adjust.
- Since Q1 2022, our forecasts have indicated a similar pattern of significant repricing and rebound, which has now begun but cannot be confirmed as accurate until 2026-28.
- Given that property markets have traditionally followed a cyclical pattern, it is reasonable to anticipate an upswing.
Forecast-based Top Markets Outperformed in the Past
- Clearly, accurately predicting yields and returns across European markets has been challenging. However, can we draw any other conclusions from our market-level forecasts?
- Since most investors are committed to investing for the long term, it would be useful to assess how much selecting the right market segments can enhance returns.
- In that respect, our market-level forecasts can be useful, as we have historical forecasts that can be tested across 138 markets with actual realized return data for the full five years.
- Our back-testing shows that the top 25% of ranked markets consistently outperformed by between 260bps and 420 bps p.a. across the five forecast periods that were tested.
- Similarly, the bottom 25% of ranked markets consistently underperformed the overall market average.
- This confirms that prime market forecasts could be useful for portfolio construction, even though careful asset selection and asset management might enhance fund-level returns.
This material is intended for information purposes only and does not constitute investment advice or a recommendation. The information and opinions contained in the material have been compiled or arrived at based upon information obtained from sources believed to be reliable, but we do not guarantee its accuracy, completeness or fairness. Opinions expressed reflect prevailing market conditions and are subject to change. Neither this material, nor any of its contents, may be used for any purpose without the consent and knowledge of AEW. There is no assurance that any prediction, projection or forecast will be realized.