The U.S. economy approaches midyear facing an old-fashioned potential macroeconomic spoiler: an energy price shock. A sharp rise in oil and gasoline prices tied to a Middle East conflict has arrived at a moment when growth had already slowed in response to last year’s tariff and immigration disruptions. The immediate effects are familiar: real purchasing power is squeezed, headline inflation pops, and consumer confidence deteriorates. The open question is whether this is temporary or longer lasting.
Summary
- We continue to expect no U.S. recession during 2026, but the economy is slowing as higher energy prices act as a tax on consumers. Regional or metro specific recessions or growth recessions are likely.
- Inflation reaccelerates near-term, then presumably eases as energy prices move back towards pre-war levels. Underlying inflation continues to cool as wage growth and shelter inflation decelerate.
- The Fed stays on hold amidst uncertainty, but a gradual easing cycle towards year-end is plausible if headline inflation rolls over and growth stays soft. We believe the new Fed Chair will ultimately be approved and will find a way to deliver rate cuts.
- A prolonged geopolitical shock that keeps oil prices elevated would meaningfully worsen the consumption outlook and delay disinflation.
- U.S. CRE is shifting from a protracted stasis in values to selective value improvement. Transaction volume in Q1 accelerated to pre-COVID levels, still down from the recent peaks in 2021 and 2022 but back in line with 2019. Despite this, overall appreciation in the NCREIF Property Index (NPI) for Q1 was only 0.08%.
Slower Growth, But Not Recession
Consumer spending is under pressure as higher gasoline and utility bills reduce real purchasing power, particularly for middle- and lower- income households. The transmission mechanism is straightforward: the effective “oil tax” from higher energy prices is quickly eroding what had looked like a supportive early-year stimulus from larger-than-normal tax refunds and new lower tax withholding rates. Households are now spending materially more per month on energy than a year ago, an offset that effectively neutralizes much of the temporary fiscal tailwind. Reflecting this, the preliminary estimate of Q1 annualized real GDP growth was only 2.0%, below expectations but an improvement from the 0.5% annualized growth reported for Q4. Fourth-quarter growth was distorted lower by the impact of the federal government shutdown and, consequently, first-quarter growth was biased upward by approximately 70 basis points by catch up in government activity. Considered together, the past six months show annualized real growth of only 1.2%. More significantly, the Federal Reserve’s real time estimate of Q1 GDP growth (GDPNow) revealed steady erosion from 3% expected growth prior to the start of the Iran War to less than 2% right before the actual release of Q1 data.
FIGURE 1: REVISIONS TO Q1 GROWTH EXPECTATION SINCE START OF IRAN WAR

Source: Federal Reserve Bank of Atlanta, GDPNow
As in most late-cycle environments, the consumer picture is increasingly bifurcated. Higher-income households retain liquidity and wealth buffers and can absorb higher fuel costs with fewer behavioral changes. Lower-income households, by contrast, have largely exhausted their pandemic-era excess savings and are more exposed to rising prices and borrowing costs. Survey data already point to rising financial stress with more reliance on revolving credit and a higher perceived risk of missed payments. Strikingly, confidence has fallen sharply over the past two years and has taken an additional leg down since the war began. Overall consumer confidence now sits at the lowest level since the University of Michigan survey began in the early 1950s.
FIGURE 2: CONSUMER CONFIDENCE AT ALL TIME LOWS

Source: University of Michigan, as of May 2026
Inflation: Temporary Reacceleration, Then Re-Anchoring?
Inflation has reemerged as a headline concern in early 2026, driven overwhelmingly by energy. Gasoline and utilities have swung from a drag to a meaningful positive contributor to year-over-year CPI, lifting headline prints even as the underlying trend continues to soften. In other words, this is mostly a price-level shock rather than a broad-based re-acceleration in the inflation regime, assuming of course that this is a temporary acceleration of energy prices and not a protracted or structural change.
Energy aside, disinflation forces remain intact. Wage growth is cooling as labor market tightness eases, and shelter inflation is slowing with a lag. Measures of worker wage expectations and quitting behavior have largely normalized to pre-pandemic patterns, implying limited risk of a wage-price spiral. Despite this, bond market pricing expectations for future inflation continue to inch higher, in line with the path charted by tariff-related inflation concerns at this time last year.
FIGURE 3: EXPECTED INFLATION OVER NEXT FIVE YEARS

Source: Treasury
Fleeting Job Growth
The labor market continues to cool. Payroll growth has moved toward breakeven levels as labor demand softens, job openings and postings have declined, and hiring intentions have turned more cautious in response to heightened uncertainty. For the quarter, the U.S. economy added approximately 200,000 net total jobs, an increase of only 0.1%. While the downward trend in aggregate employment growth has finally flattened (Figure 4) and has stabilized at annual growth rate slightly above zero. Going forward, investors need to recalibrate their understanding of what a “good” jobs report entails. With limited population and labor force growth, the economy will likely produce far fewer net new jobs each month.
FIGURE 4: STEADILY SLOWING JOB GROWTH

Source: Bureau of Labor Statistics (BLS)
To this point, recent Census data shows U.S. population growth slowing sharply during 2025, largely in response to significantly reduced immigration1. Census estimates reflect data through midyear 2025 and likely underestimate the degree of net out migration during the second half of 2025. As such, other estimates from non-government groups such as Pew Research and Brookings suggest the U.S. likely experienced negative net migration for the year which, if true, would further reduce the national population growth for 2025 and possibly beyond.
Monetary Policy: On Hold, But New Sheriff Coming to Town
The Federal Reserve remains on hold after completing its tightening cycle, balancing near-term headline inflation against weakening growth momentum. With real rates already restrictive and demand softening, further hikes appear unlikely in the base case, particularly as the transition to a new Federal Reserve Chairman appears to have restarted at the end of April. At the same time, any move to cut rates also seems constrained. Regardless, prediction and asset market pricing show little evidence that policy rates and, by extension, Treasury yields are likely to change meaningfully in the near-term. Since the start of the war at the end of February, the futures market expectation of the one-month SOFR (a proxy for the Fed Funds policy rate) has shifted upward by approximately 50 basis points, suggesting no interest rate cuts by the Federal Reserve this year and possibly next. For its part, the suggested path for the yield on the benchmark Treasury bond has also shifted upward, albeit by a somewhat smaller amount (approximately 30 basis points). For property investors hoping for valuation support from a generally lower yield environment, all of this indicates that any near-term value increase will come not from compressing property yields but rather from fundamental growth in property earnings (NOI).
FIGURE 5: FUTURE PATH OF LONG AND SHORT INTEREST RATES

Source: Chatham Financial
U.S. Commercial Property
U.S. commercial property continues to produce positive total returns but anemic capital appreciation, with the NPI Capital Value Index rising less than 0.1% during the first quarter. Following ten consecutive quarters of capital value decline, the NPI has now shown positive appreciation in each of the past five quarters totaling only 30 basis points of aggregate value increase.
FIGURE 6: QUARTERLY CHANGE IN NPI CAPITAL VALUE INDEX 2022 Q1 – 2026 Q1

Source: NCREIF
In large part, the absence of appreciation over the past five quarters reflects still lower-than-average property yields (cap rates) relative to other asset yields, specifically the Treasury bond yield. As of Q1, the NPI aggregate cap rate (4.57%) stood 27 basis points above the 10-year Treasury yield (4.3%), in sharp contrast to the average spread over the past 20 years of approximately 200 basis points. Broadly, this suggests a further elongated period of limited capital appreciation as property yield spreads continue to revert towards historic norms through property NOI growth, additional property valuation adjustment or eventual declines in Treasury yields—or some combination of the three.
FIGURE 7: NPI AGGREGATE CAP RATE SPREAD TO 10-YEAR TREASURY YIELD

Sources: NCREIF, Treasury
Transaction Volume Recovery
Liquidity is improving from the 2023–2024 trough, but not uniformly. Even modest improvements in loan proceeds and spreads can reopen the bid side for stabilized assets in multifamily, industrial and necessity-based retail. That said, the market is still working through a meaningful legacy-loan overhang: maturities, extensions and workouts will continue to create forced decisions. Practically, two markets will coexist over the next year: a relatively functional market for high-quality, well-leased assets at reset pricing, and a resolution market where clearing prices depend on capital stack restructuring and fresh equity. In aggregate, total CRE transaction volume over the past four quarters is back to approximately $600 billion, far below the $1 trillion record volume of 2022 but consistent with levels seen prior to the pandemic.
FIGURE 8: U.S. COMMERCIAL PROPERTY TRANSACTION VOLUME TRAILING FOUR QUARTER TOTAL

Source: RCA/MSCI
Near-Term Property Sector Outlook
The near-term CRE investment environment will be shaped, as always, by macro variables: (1) the trajectory of inflation after the energy-driven spike, (2) the timing and pace of any Fed easing, and (3) whether slower growth becomes slower occupier demand. Despite the paucity of headline growth, the U.S. remains the largest and most diverse economy and property market. The same Census data that showed significantly slowing in aggregate population also showed continued strong migration within the U.S. still favoring various locations in the southeast, southwest and mountain states. At the same time, the U.S. age structure offers significant “temporal” growth patterns with millions of Americans aging into the oldest age groups every year, creating significant new demand for a variety of real estate categories such as seniors housing and medical offices.
In the “no recession” baseline, the typical sequence is a gradual thaw: transaction activity improves first, cap rates stabilize next, and leasing/rent growth becomes durable last. Even in that constructive path, the binding constraint remains the cost and availability of debt—many transactions still require either a clear NOI growth story, meaningful seller price adjustment, or structured capital (preferred equity, JV capital, assumable debt) to clear return hurdles.
Office
The office sector appears to be transitioning out of its trough, though improvement remains concentrated in specific markets. The uneven distribution of demand growth, combined with restrained hiring activity, suggests that the recovery remains fragile as a new cycle begins. Even so, demand is gradually broadening, with net absorption of buildings more than ten years old turning positive at the end of 2025 for the first time since 20182, an indication that recent leasing activity is extending beyond a narrow set of assets. While leasing volumes have moved higher, activity remains below levels observed in the prior expansion. Among major markets, New York continues to differentiate itself, supported by strong in‑office utilization and consistent leasing from financial services tenants. San Francisco has also regained traction, recording the second‑highest absorption among the top-ten markets over the past four quarters, signaling the early stages of what is likely to be a prolonged recovery following historically elevated vacancy.
Leasing conditions improved in early 2026. According to CBRE, annual absorption rose from roughly one‑third of pre‑pandemic norms to just over half, totaling more than 6 million square feet (msf) in the first quarter. Increased office attendance and a limited supply of high‑quality new space contributed to a modest decline in vacancy, which fell to 18.6%, while overall availability edged down to 23.8%. Sublease space represented 1.6% of total vacancy, and direct vacancy remained stable at 17.0%. First‑quarter absorption exceeded the combined total recorded in the first half of 2025, though it remained well below the elevated pace achieved during the third quarter.
Corporate return‑to‑office initiatives continue to be implemented alongside portfolio rationalization efforts, including space reductions, relocations, and workforce adjustments, which have limited net expansion in occupied square footage. To date, New York and Dallas are the only major markets to record five or more consecutive quarters of positive absorption, while most other large urban centers continue to face softer demand amid economic uncertainty and ongoing space givebacks. On a trailing 12‑month basis, Dallas’ absorption remains modestly above its pre‑COVID average, while San Francisco’s annual absorption has risen to more than double its pre‑pandemic level, with the majority of activity concentrated in the first quarter of 2026. The longer‑term implications of automation‑driven productivity gains relative to corporate efforts to increase in‑office attendance on office demand remain unclear.
Performance across the top-ten office markets continues to diverge. New York and San Francisco generated net absorption well above historical benchmarks over the past year, while Dallas, Washington, D.C., Houston and Boston also posted positive results in line with or slightly below longer‑term averages. In contrast, Atlanta, Chicago, Los Angeles and Seattle reported net negative absorption. Among these lagging markets, Chicago was the only one where absorption remained below its post-COVID average. This dispersion underscores the uneven nature of the recovery, shaped by localized economic conditions, tenant demand profiles and evolving space‑use patterns. Tracking these dynamics will be critical to assessing the durability of recent improvements and identifying relative market opportunities.
FIGURE 9: ANNUAL VS. LONG-TERM AVERAGE ABSORPTION

Source: CBRE-EA Historical Data from 1Q2026
Tenant behavior continues to trend toward efficiency, with tenants prioritizing smaller, more flexible footprints. While leasing momentum has improved, average transaction size remains approximately 15% below historical norms. This pattern is expected to persist as large corporate tenants with seven- to ten‑year lease commitments adjust portfolios to align with evolving workplace strategies. At the same time, employment growth has stalled, with Bureau of Labor Statistics data indicating a decline of roughly 700,000 jobs in major knowledge‑based industries from the April 2023 peak3. Over the longer term, this dynamic is expected to reverse, with employment growth projected to average 0.2%–0.3% annually over the remainder of the decade.
Capital market activity has also become more constructive, aiding price discovery and improving transparency around valuation resets. Owners and lenders are increasingly pursuing exits from stressed assets while buyers are showing greater willingness to underwrite investments at adjusted pricing levels. Despite this progress, a pronounced divide remains between well‑located, competitive properties and assets facing functional obsolescence, leading some owners to evaluate conversion or demolition strategies. In 2025, approximately 55 msf of office space was delivered, while more than 40 msf was removed from inventory, according to CoStar. Reflecting these dynamics, NCREIF’s value‑weighted office cap rate index declined modestly to 5.6% in the fourth quarter, down from 5.9% in mid‑2025.

Apartment
U.S. apartment fundamentals showed early signs of stabilization in the first quarter of 2026 as the sector moved further beyond the peak supply pressures of the prior two years. Following an unprecedented development cycle that peaked with more than 450,000 units delivered in 2024, annual completions declined to roughly 369,000 units in 2025, an 18% decline. Total U.S. apartment inventory reached approximately 18.3 million units as of Q1 2026, reflecting less than 1% year-over-year growth, a material deceleration from inventory growth rates exceeding 2.0% annually during the 2023–2024 peak delivery period. While performance remains uneven across markets, the sharp slowdown in deliveries is beginning to improve supply‑demand balance.
FIGURE 10: U.S. APARTMENT VACANCY RATE & RENT GROWTH

Source: CBRE-EA
National vacancy held roughly flat at approximately 4.8% in Q1 2026, down slightly from 5% at year-end and in-line with the 4.7% vacancy rate in Q1 of last year. This follows a period of rapid vacancy expansion in 2023 and early 2024, during which vacancy increased by roughly 70–90 basis points nationally.
Net absorption totaled approximately 78,000 units year-to-date, ahead of the roughly 58,000 units of new deliveries. By comparison, Q1 2025 absorption trailed supply by approximately 15,000–25,000 units, highlighting a clear reversal in net demand‑supply dynamics.
Rent growth remained subdued in Q1, with effective rents essentially flat on a year‑over‑year basis. Average monthly rent per unit nationally remained near $1,500, reflecting year-over-year growth of less than 1%, down sharply from year-over-year growth of more than 8% in 2021 and 5% in 2022. Elevated vacancy, increased tenant choice and widespread concessions continue to limit landlords’ pricing power. These pressures are most pronounced in high‑supply Sunbelt markets, where cumulative inventory growth since 2022 often exceeds 10% to 15%, translating into outright rent declines of 1% to 3% year-over-year in select submarkets. Coastal and supply‑constrained gateway markets have shown greater resilience, while Midwest markets generally reflect low single‑digit year-over-year rent softening, rather than sharp corrections.
FIGURE 11: APARTMENT VACANCY RATE - CHANGE FROM Q1 2025 TO Q1 2026

Source: CBRE-EA 2026 Q1
Demand‑side conditions remain supportive but have normalized from prior-cycle extremes. Net absorption peaked at over 620,000 units in 2021, was slightly negative in 2022 before rebounding to approximately 245,000 units in 2023 and over 530,000 units in 2024 (or 118% year-over-year). Absorption moderated again in 2025 amid slower job growth and reduced migration flows. Compared with Q1 2025, early‑2026 absorption is tracking approximately 15%–20% lower year-over- year, consistent with late‑cycle normalization rather than structural demand weakness.
FIGURE 12: U.S. APARTMENT MARKET SUPPLY & DEMAND

Source: CBRE-EA, 2026 Q1
The most meaningful shift in the apartment market continues to occur on the supply side. As noted, annual completions declined by approximately 18% year-over- year in 2025, and year‑to‑date 2026 deliveries show an additional 55%–60% decline from the prior year based on current quarterly pacing. New unit construction remains well below recent peaks, constrained by elevated financing costs and tighter lending standards. At the same time, however, net absorption (demand) also continues to normalize towards pre-pandemic levels.
While new supply is moderating in aggregate, there remain pockets of development to note. In particular, southern markets such as Richmond, Charlotte and Raleigh as well as Salt Lake City will likely see a longer period of new unit pressure on occupancy and rent as the current supply cycle abates over the next 12 to 24 months.
TABLE 1: U.S. APARTMENT MARKETS CURRENTLY WITH 5% OR MORE OF TOTAL STOCK UNDER CONSTRUCTION

Source: CBRE-EA
Capital markets conditions for apartments remain challenging but show clear signs of stabilization. Rolling four‑quarter multifamily transaction volume totaled approximately $167 billion as of Q1 2026, representing a 10%–15% increase year-over-year from the late‑2024 trough. However, volume remains more than 50% below the $350 to $420 billion annualized peak recorded during 2021–2022. Cap rates have largely stabilized after expanding for two consecutive years and the pace of valuation declines has slowed materially on a year-over-year basis, suggesting that the bulk of rate‑driven repricing is now reflected in values.
FIGURE 13: MULTIFAMILY SALES VOLUME – Q1 2026

Source: RCA
Looking ahead, the near‑term outlook for the apartment sector remains cautious but increasingly constructive. With completions expected to decline further through the balance of 2026 and net absorption projected to remain positive, vacancy is expected to compress modestly on a year-over-year basis (‑20 to ‑40 bps). Rent growth should recover into the low single‑digits (1%-3% year-over-year) as competitive pressures ease, though outcomes will likely remain uneven across regions. Oversupplied Sunbelt markets are likely to lag the recovery, while supply‑constrained and structurally resilient markets should tighten more quickly.
Overall, the U.S. apartment market in early 2026 appears to be in the latter stages of bottoming. While near‑term softness persists in select metros still digesting elevated deliveries, year-over-year trends across supply, vacancy, absorption and transaction activity point increasingly toward stabilization. For investors and owners, the focus remains on income durability and execution in the near-term, with improving fundamentals expected to support stronger performance into 2027.

Industrial
U.S. industrial fundamentals showed early signs of stabilization in the first quarter of 2026 as the sector moved beyond the severe oversupply pressures of the prior two years. The balance between new supply and demand is improving, and the broader industrial cycle appears to be transitioning out of its trough phase. Total U.S. industrial stock reached approximately 16.7 billion sf in the quarter, an increase of 1.4% from Q1 2025.
A key contributor to improving conditions is the continued downshift in new deliveries. Annual completions peaked at approximately 490 million square feet (msf) in 2023 before declining to roughly 244 msf in 2025, an overall decline of nearly 50%. National availability held roughly stable in Q1, though still elevated. Availability registered 9.3% in Q1 2026, up 40 basis points (bps) from one year ago, reflecting an environment that is no longer worsening rapidly but one that still offers tenants meaningful leverage in many markets. For its part, demand improved materially year-over-year, with approximately 34.4 msf absorbed in Q1 2026, compared to 5.4 msf in Q1 2025. While encouraging, aggregate net absorption remains far below the peak demand of 2021 and 2022.
FIGURE 14: U.S. INDUSTRIAL AVAILABILITY & RENTAL GROWTH

Source: CBRE-EA
Rent growth remained subdued overall, though headline asking metrics show modest upward pressure rather than broad acceleration. Average gross asking rents rose approximately 3.6% from $12.91 psf in Q1 2025 to $13.81 psf in Q1 2026. Meanwhile, average effective asking rents stayed nearly flat (from $10.93 psf in Q1 2025 to $11.00 psf in Q1 2026, consistent with a market where concessions and competitive lease-up dynamics continue to cap effective pricing power.
Demand-side conditions remain fundamentally supportive but have moderated from the exceptional levels recorded earlier in the cycle. Slower economic and trade growth alongside normalized goods consumption have reduced the pace of warehouse leasing relative to 2021 highs. At the same time, structural demand drivers such as e-commerce, third-party logistics, inventory management practices and manufacturing/near shoring continue to underpin positive (if more normalized) absorption.
Rising fuel costs tied to disruption in and around the Strait of Hormuz add a meaningful layer of cost pressure to the industrial and logistics landscape, even absent sustained physical supply interruptions. Per CNBC, U.S. diesel prices rose beyond $5 per gallon for the first time in three years. This reflects a 34% increase in the price per gallon since the start of hostilities in the Middle East.
An increase in the price of diesel oil will cause heightened transportation expenses across trucking, port drayage and intermodal networks. For occupiers, this tends to compress operating margins and encourages tighter routing, greater emphasis on distribution efficiency, and, in some cases, higher inventory buffering closer to end markets to reduce long‑haul exposure. For owners, elevated fuel costs can modestly dampen near‑term demand for far‑flung, purely cost‑driven distribution locations, while reinforcing the relative attractiveness of infill, port‑proximate and population‑adjacent assets that shorten delivery times and reduce transportation volatility. More broadly, sustained energy cost pressure acts as a tax on goods movement, weighing on demand elasticity and reinforcing the late‑cycle, margin‑conscious behavior already evident across the industrial market.
FIGURE 15: U.S. INDUSTRIAL MARKET SUPPLY & DEMAND

Source: CBRE-EA
The most meaningful shift continues to occur on the supply side. The development pipeline has contracted substantially and deliveries are now receding from their 2022–2023 peak period. That supply downshift is visible both in annual delivery trends (2023 → 2025) and in the quarterly trend where completions fell 12% year- over-year in the first quarter. While availability remains elevated, the market is beginning to digest excess space created during the surge in construction. The increase in availability is only 40 bps, a meaningful stabilization compared with the sharper run-up experienced earlier in the oversupply phase.
FIGURE 16: INDUSTRIAL AVAILABILITY RATE - CHANGE FROM Q1 2025 TO Q1 2026

Source: CBRE-EA
Capital markets conditions remain challenging but appear to be stabilizing. Industrial sales volume totaled approximately $120.1 billion on a rolling four‑quarter basis as of Q1 2026, up more than 15% from $103.9 billion a year ago. Quarterly volume also increased, with $30.4 billion in transactions versus $24.2 billion in Q1 2025. Even with this improvement, activity remains well below the prior-cycle peak levels, constrained by higher interest rates, conservative underwriting, and bid–ask spreads.
FIGURE 17: INDUSTRIAL SALES VOLUME – Q1 2026

Source: RCA
Looking ahead, the near-term outlook follows a trend of recovery from a plateau. With supply continuing to taper and absorption remaining positive, availability should gradually improve and rent growth should recover modestly, though performance will remain uneven across markets and property segments. Oversupplied big-box markets are likely to lag the recovery, while supply‑constrained and strategically located markets should tighten more quickly. Overall, the U.S. industrial market in early 2026 appears to be in the later stages of bottoming. While some softness persists in select areas, particularly metros still digesting recent deliveries, the improving supply backdrop and durable underlying demand drivers position the sector for a gradual recovery into 2027.

Retail
Retail conditions were broadly steady in the first quarter, suggesting the sector is moving into a more even supply‑demand posture. National availability increased 10 basis points to 4.9%, up from 4.8% in the fourth quarter and consistent with readings from the midpoint of 2025. While availability remains low by historical standards, the recent shift may indicate the market is settling into a more neutral phase, with absorption tracking closely alongside the still‑limited pace of new supply.
FIGURE 18: RETAIL FUNDAMENTALS

Source: CBRE-EA
New construction remained limited, as less than 5.0 million square feet (msf) delivered in Q1, bringing trailing 12‑month completions to 26.0 msf, below the 30.5 msf delivered over the prior 12 months4. Inventory increased only 0.3% year over year, reinforcing how constrained development remains. Across the country, pipelines are thin and projects underway sit near cyclical lows, pressured by elevated construction costs, restricted financing and ongoing tariff-related uncertainty. These pressures continue to curb speculative starts, keeping development concentrated in locations where demand is well established, particularly growing suburban corridors and top‑performing retail nodes.
TABLE 2: TOP TEN MARKETS BY YTD COMPLETIONS
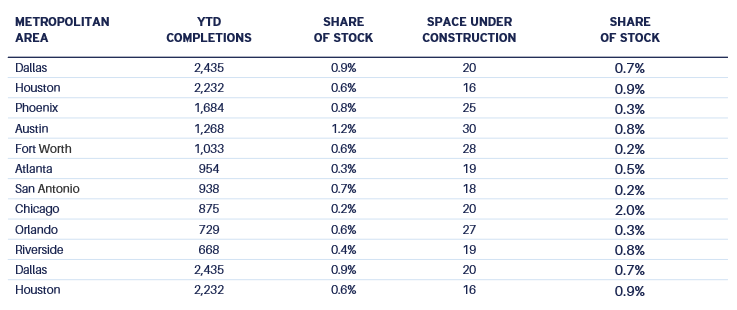
Source: CBRE-EA, as of Q1 2026
Tenant demand moderated following the strong close to 2025, with net absorption easing to 1.7 msf in the first quarter, a meaningful decline from Q4 that represents just 13% of the prior quarter’s pace5. While absorption remained below the elevated levels recorded immediately after the pandemic, it marked an improvement from year‑ago results that were net negative. Market participants continue to report rapid re‑tenanting of second‑generation space, particularly in well‑located and higher‑performing centers, helping tighten conditions in select markets. Leasing activity remains a source of support amid limited new supply, with competition for high‑quality space intensifying among service, fitness, discount and quick‑service operators. Smaller‑format space remains especially constrained, while availability among larger boxes has shown greater quarter‑to‑quarter variability, even as lease‑up timelines remain near record lows.
Despite the modest tightening in market conditions, rent growth remains subdued at 1.9%, still near post‑recovery lows reached in 2Q 2021, which has improved tenants’ negotiating position. The decade-long shortfall in new development continues to anchor fundamentals even as rent gains remain soft. Year‑over‑year rent growth has held relatively steady over the past five quarters, consistent with a shift away from the outsized increases recorded in the prior three‑year period. Regional outcomes remain uneven, with the South continuing to post stronger rent gains while Western markets trail.
Where development is advancing, it is highly targeted. Activity is concentrated in pre‑leased pad sites, build‑to‑suit projects, and grocery‑anchored formats, with an emphasis on tenant categories tied to dining, entertainment and omnichannel retail. This approach is largely focused on improving and repositioning existing retail environments rather than introducing broad new vacancy. Elevated interest rates and lengthy entitlement processes continue to slow new starts, keeping near‑term supply growth contained.
Overall, first‑quarter results reinforce a continued transition toward more normalized conditions. With limited new supply and demand that remains steady, the sector appears positioned for stability through the remainder of 2026. Retailers continue to act quickly to secure scarce, well‑located space, while landlords remain focused on curating tenant mix and retaining stronger operators. After several years of volatility, today’s restrained supply backdrop and still‑constructive leasing environment support expectations for steady performance over the year ahead.

1 https://www.census.gov/newsroom/press-releases/2026/population-estimates-age-sex.html
2 CoStar National Office Report 2026Q1
3 CoStar National Office Report
4 CBRE-EA Total Retail Market History 1Q2026
5 CBRE-EA Total Retail Market Fundamentals History 1Q2026
For more information, please contact:
MICHAEL ACTON, CFA®
Managing Director, Head of Research & Strategy, North America
michael.acton@aew.com
+1.617.261.9577
JAY STRUZZIERY, CFA®
Head of Investor Relations
jay.struzziery@aew.com
+1.617.261.9326
This material is intended for information purposes only and does not constitute investment advice or a recommendation. The information and opinions contained in the material have been compiled or arrived at based upon information obtained from sources believed to be reliable, but we do not guarantee its accuracy, completeness or fairness. Opinions expressed reflect prevailing market conditions and are subject to change. Neither this material, nor any of its contents, may be used for any purpose without the consent and knowledge of AEW. There is no assurance that any prediction, projection or forecast will be realized.
