- As 2026 has started, we provide a reminder and update on the reasons for investing into European real estate and identify the specific markets where we believe the best risk-adjusted returns can be expected.
- The latest data confirms that real estate remains a useful diversifier for global mixed asset investors. Strong European stock performance has triggered many to be under-invested in real estate given the prevailing 10% target. The projected market recovery provides a good opportunity to bring real estate back in line with this target.
- European real estate has delivered a relatively stable income return of 4-6% p.a. over the last 20 years. Our projected prime current income yield of 5.3% p.a. for our full coverage of 196 markets for the next five years should likely prove attractive as valuations in other asset classes get increasingly difficult to sustain.
- In addition to current income, European real estate is forecast to deliver capital appreciation of 2.1% p.a. from rental growth and 1.0% p.a. from yield tightening for a total return of 8.4% p.a. Even without the more difficult to predict yield shifts our projected 2026-30 total returns are consistent with 15 and 20-year actual averages.
- From backtesting our past forecasts, it is confirmed that the top 25% markets by projected returns for all six available 5-year historical periods consistently outperform the overall market average. Further comparison also shows that our sector-level total return projections sit generally between two reputable external sources.
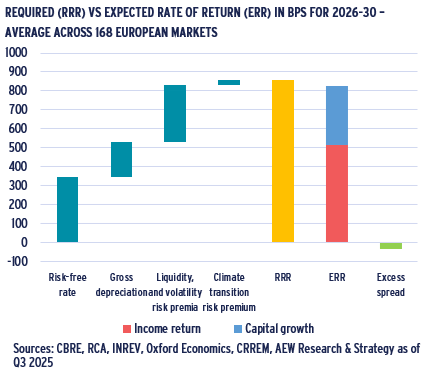
- Our 2026-30 projections estimate an 8.2% p.a. expected rate of return (ERR) and an 8.6% p.a. required rate of return (RRR) for a restricted 168 markets coverage. This higher RRR implies a negative -33bps spread signaling investors to be more selective as the negative excess spreads for some markets can be a multiple of this European average.
- Based on the RRR and ERR each of the 168 market segments is classified. Our Sep-25 analysis shows 13% attractive, 66% neutral and 21% as less attractive. This means that in nearly 80% of European markets, investors meet or exceed their required returns. Office and retail markets are most represented in the attractive category.
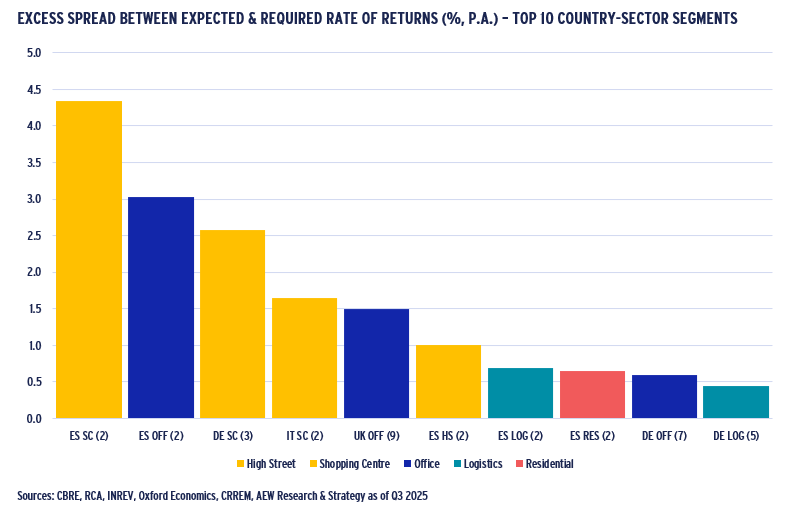
- In our top 10 country-sector ranking based on excess spread between ERR and RRR, Spanish shopping centres come top followed by German and Italian shopping centres and Spanish and UK offices. Spain is the most featured country in our top 10 with all five sectors followed by Germany with three sectors and Italy and UK each with one.
REAL ESTATE IN A MULTI-ASSET PORTFOLIO
REAL ESTATE CAN OFFER SOLID DIVERSIFICATION FROM PRIVATE ASSETS
- Institutional investors seek to diversify traditional stocks and bonds portfolio with private assets.
- Using Preqin’s private assets total returns indices, we can compare diversifying properties of a wide range of private asset classes and their sub-classes.
- For simplicity, we illustrate only the largest groups of these asset types with global focus. However similar conclusions also hold for geographical and strategy sub-classes.
- Correlation coefficients based on quarterly data from Q2 2007 to Q2 2025 show that real estate is the strongest diversifier for a traditional stocks and bonds portfolio.
- This is evident from the correlation coefficient of real estate with global bonds at -0.16 and with global equities at 0.23, which are the lowest amongst private asset classes.
- Real Estate is closely followed by Infrastructure, while private debt and private equity strategies are more correlated with the stock market.
EUROPEAN STOCK RALLY NOT MATCHED BY REAL ESTATE & BONDS
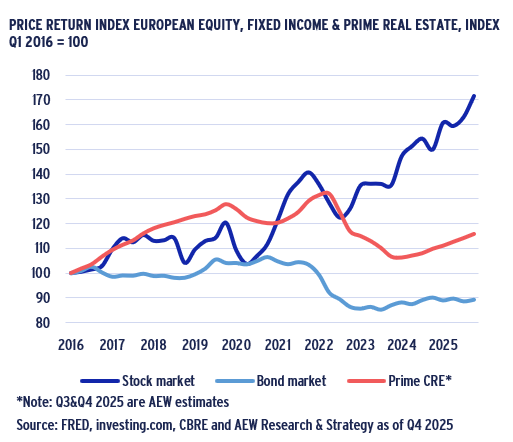
- A closer look at the European context shows the historical pricing trends since 2016 for stocks, bonds and real estate.
- In the graph, European real estate is proxied by CBRE prime capital returns, European equities by STOXX 600 index, and European bonds by iShares € Aggregate Bond ETF price.
- European bond prices haven not recovered since the interest rate hikes in 2022-23.
- In contrary, real estate has never dropped to below its 2016 levels and has started a rebound already in 2024.
- The European stock market had periods of adjustments in 2020 and 2022 but posted significant growth in both post-pandemic and post-interest rate hikes periods.
- Given that most institutional investors have stable long term asset allocation targets, significant differences in price growth among asset type creates re-balancing challenges.
REAL ESTATE ALLOCATION BELOW TARGET SINCE 2024
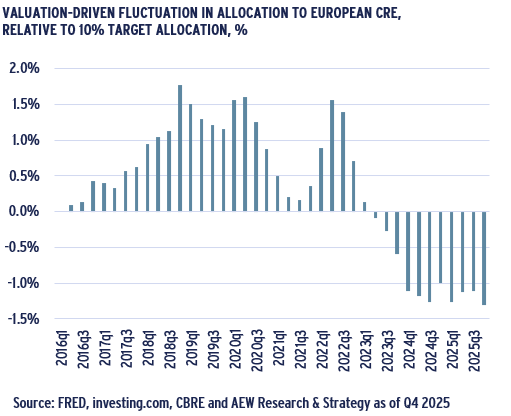
- Assuming a 10% target real estate allocation, with 50% equities and 40% bonds, a denominator effect is estimated.
- INREV’s 2016 Investment Intentions survey showed an average allocation of 10.3%, supporting our assumption.
- Using historical price indices and keeping the target at 10%, we estimate how much over or under the 10% target portfolios would be, assuming no active rebalancing.
- Based on this, real estate exceeded the 10% in 2016-20, while the Covid-triggered asset repricing caused property allocations to return more closely to the 10% target
- In the immediate post-Covid 2021-22 recovery, again real estate targets were exceeded.
- However, in the post-rate hike market correction, the real estate allocations remain at below 9% target since 2024, triggering further capital allocations to the sector.
- These figures are again confirmed by INREV latest 2025 data reporting a 8.7% average allocation to real estate.
SOLID INCOME TO DRIVE REAL ESTATE RETURNS
HIGH AND RELATIVELY STABLE YIELDS SHOULD PROVE ATTRACTIVE
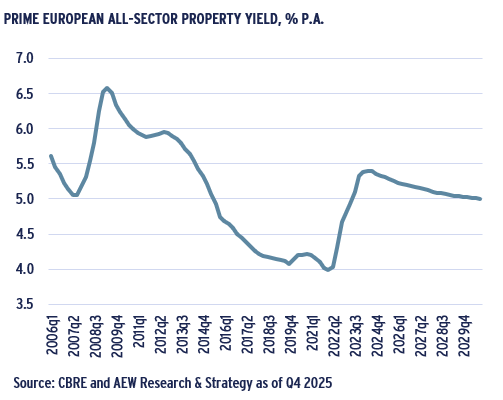
- The attraction of real estate for many multi-asset investors is the relatively high- and stable-income return, which is shown by the all-sector prime property yields in the chart.
- The data shows clearly that European real estate has gone through a significant re-pricing since mid-year 2022.
- After central banks hiked their policy rates to fight rampant inflation, government bond yields and with some delay and moderation prime yields widened out.
- This was obviously a painful adjustment for most investors (and lenders) with legacy holdings (and financings) acquired in the preceding period of lower yields.
- However, going forward for new investors the 5.0%-5.5% current income level is more appealing than the 4.0%-4.5% levels seen over the 2015-22 period.
- Even if prime property yields are not at the 5-6% levels seen in the 2006-15, the relative tight range of income yields between 4%-6% is an attractive feature for many.
2026-30 RETURNS DRIVEN BY CURRENT INCOME AND RENTAL GROWTH
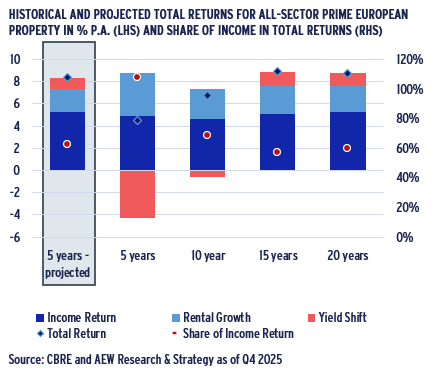
- In addition to current income and value appreciation from yield shifts our total returns also include rental growth. The latter is not available in passive bond investing.
- When we compare our current 2026-30 total return forecasts with historical actual returns in their different components a few interesting things emerge.
- Over the 15 and 20 years, current income makes up near 60% of total return, which is in line with our forecast for the next five years.
- Our 2026-30 forecasts also have a consistent pattern of current income, rental growth and yield shift relative to the 15 and 20-year averages.
- Based on this, we expect that our latest forecasts are relatively conservative even after the significant capital value losses many endured.
- In fact, the last 5 and 10 years of historical returns confirm this re-pricing as the upward yield shift triggered negative capital appreciation, even with positive rental growth.
UK OFFICES RANKED TOP - EVEN WITHOUT YIELD SHIFT
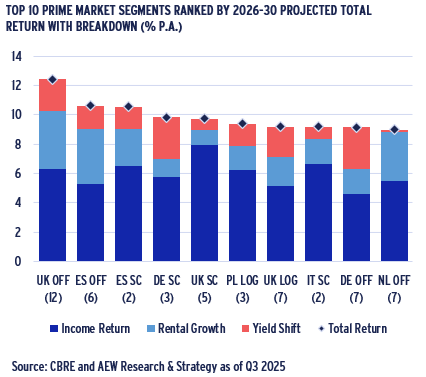
- If we look at our projected 2026-30 returns across countries and sectors, we note that UK offices offer the best returns at 12.4% p.a., followed by Spanish offices at 10.6% p.a.
- Spanish, German and UK shopping centres are next in our ranking at 10.5% p.a., 9.8% p.a. and 9.7% p.a., respectively.
- In 6th and 7th position are Polish and UK logistics with German and Dutch offices round out our top ten ranking.
- When we consider the components of return and assume that capital appreciation from yield tightening is most difficult to forecast, a few additional points can be made.
- UK shopping centers and Dutch offices have the lowest portion of yield shift in their projected total returns.
- On the other hand, German shopping centres and offices returns are most reliant on yield tightening in our top 10.
- Finally, even if we exclude any harder-to-predict yield shift-driven capital appreciation, UK offices are still ranked top.
BACKTESTING OUR MARKET FORECASTS
HISTORICAL FORECASTS CONSISTENTLY PICK WINNERS & LOSERS
- To look further into the future, we can answer one of our more frequently asked questions, which is: how accurate have your historical forecasts been?
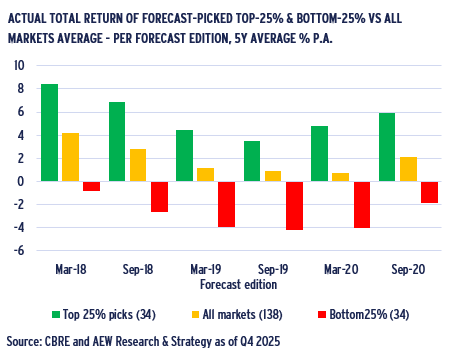
- In order to answer this question, we check all our published market level forecasts for periods where we have a realized actual prime return for all 138 markets projected.
- If we look at forecasts for the top and bottom 25% of markets by their forecasted total return for each of the six relevant projections, there are some encouraging results.
- Top 25% markets consistently outperformed the all-markets average by 370bps, while the bottom 25% markets showed -490bps underperformance over the six different periods.
- Accuracy of our previous forecasts is no guarantee that the same will be achieved with later and future projections.
- Going forward, we will monitor the accuracy of our market level projections as actual prime returns are recorded.
TOP 25% RETURN FORECASTS MARKETS MOSTLY OFFICES & LOGISTICS
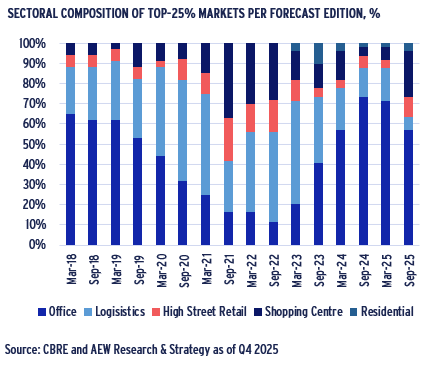
- A more detailed retrospective of our top 25% markets shows, a clear pattern of sectoral shifts. It should be noted that the number of markets covered increased over time.
- In addition, our prime returns are not risk-adjusted. This will be addressed later in our relative value approach.
- Among the 25% top projected return markets in 2018-19 over half were offices, which changed in 2020-23 to logistics becoming dominant with Sep-21 as the only exception.
- From 2024, offices again make up 50% or more of our top 25% of projected return markets. In our Sep-25 projections more shopping centers come back in the top 25%.
- This results call into question the often-repeated theme of beds and sheds as most favored sectors.
- Total returns are useful feature in portfolio construction, but do not reflect the diversification benefits of lower return and risk segments, including in residential and high street retail.
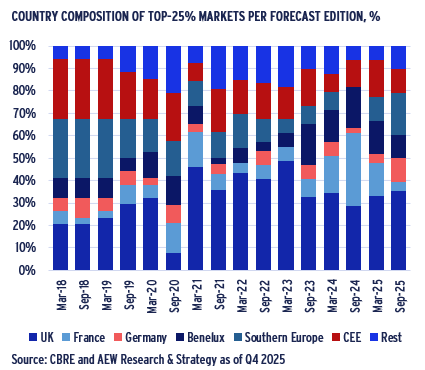
TOP 25% RETURN MARKETS FLUCTUATE MORE GEOGRAPHICALLY
- When we review the same top 25% forecasted return market segments broken down by their country allocations, the trend is a lot less consistent over time.
- In most post-Covid periods, the big four core European markets (UK, France, Germany and Benelux) make up more than 50% of the top 25%.
- Germany is showing relatively few markets in the top 25% projected return markets, but this likely because our returns are not risk adjusted.
- French markets in the top 25% reflect a bigger share but have been more variable.
- Pre-Covid, Southern Europe and CEE made up over half our top 25% markets, which was most likely reflective of higher economic and rental growth compared to core markets.
- The immediate Covid impacts in Sep-20 and Mar-21 showed big changes in geographic terms in our top 25% markets.
- Our coverage in terms of number of segments has been higher in UK, France and Germany than elsewhere.
COMPARING OUR MARKET FORECASTS TO OTHER SOURCES
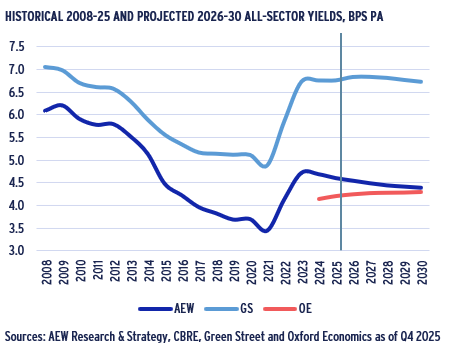
AEW YIELD FORECASTS SHOW MORE TIGHTENING THAN OTHERS
- We can now answer another frequently asked question: “How do your forecasts compare to others”?
- We do so by reviewing baseline yield, rental growth and total return projections published by Green Street (GS) and Oxford Economics (OE) with our own AEW forecasts.
- Both produce city and property type specific projections, even if sector and property quality (prime vs. average) definitions vary. Regardless of these limitations, we can compare all three variables across 88 overlapping market segments.
- GS shows increasingly higher yields as it is not reflective of prime quality assets like AEW/CBRE and OE.
- Despite these, there is a broadly similar historical pattern even if we can not show historical MSCI data for OE series.
- Going forward, OE is projecting yield widening of 10bps while GS forecasts flat yields in contrast to AEW yield tightening of 30bps over the same period and markets.
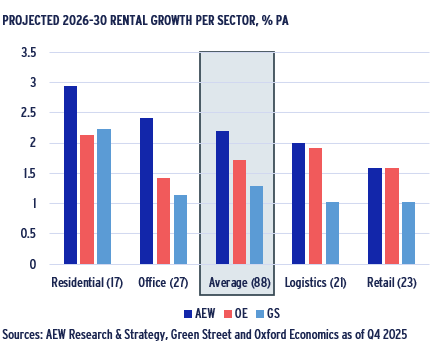
RENTAL PROJECTIONS ALSO STRONGER THAN OTHER SOURCES
- Even at a modest 2.2% p.a., AEW’s projected average rental growth for 2026-30 is considerably higher than both OE at 1.7% p.a. and GS at 1.3% p.a.
- GS has the lowest rental growth projection across all sectors, except for residential. This might be because GS does not use the prime market definition.
- Our own AEW rental projections are consistently higher across all sectors, except for retail. OE has a marginally higher rental growth projection.
- At 2.4% p.a. rental growth, AEW projects more than the double the growth in offices compared to GS’s 1.1% p.a. for the same 27 markets over the same period.
- This might be due to the continued bifurcation between prime CBD markets and non-prime assets as AEW forecasts are tracking the former and GS very likely more the latter.
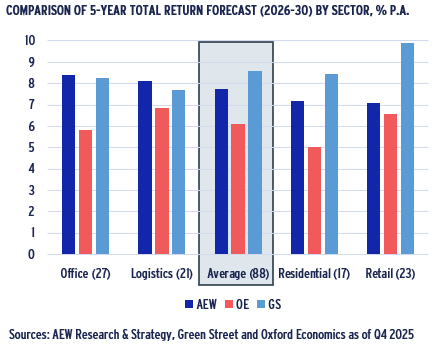
7.8% PROJECTED RETURN FROM AEW CLOSER TO GS THAN OE
- At 7.8% p.a., AEW’s projected total return for 2026-30 is significantly higher than OE at 6.1% p.a. and closer but still lower than GS at 8.6% p.a.
- Surprisingly, despite its much lower rental growth, GS 8.3% p.a. total returns for offices are very close to AEW’s at 8.4% p.a. This is likely due to GS higher yields across sectors.
- GS top returning sector is retail, which is again likely due to high initial yields as its projected rental growth is lower than our own AEW and OE’s forecasts.
- OE shows consistently the lowest returns across sectors as it has lower current and widening projected yields combined with modest rental growth.
- However, it would be great to see more backtesting from third party forecasters over holding periods relevant for direct real estate investor.
BALANCED RELATIVE VALUE ACROSS EUROPE DUE TO LINGERING LIQUIDITY RISKS
RELATIVE VALUE ANALYSES FOR 2026-30 SIGNALS CAUTION
- As before, our risk-adjusted return approach is based on a comparison of the required rate of return (RRR) and the expected rate of return (ERR) over the next five years.
- The 300bps average liquidity and volatility risk premium is the biggest change in our updated relative value analyses.
- For the 168 European market included in this relative value analysis the 2026-30 average RRR is projected at 8.6% p.a. and ERR is estimated at 8.2% p.a.
- Despite the higher liquidity risk premium, the risk-free rate of 3.4% remains the largest component of the RRR.
- This means that the ERR has a slight negative excess spread of 33bps over the RRR.
- In turn, this implies that investors need to be more selective to ensure that they are getting sufficiently compensated for the risks across European markets over the next five years.
HIGHER LIQUIDITY RISK PREMIUM PUSHES RRR TO EXCEED ERR
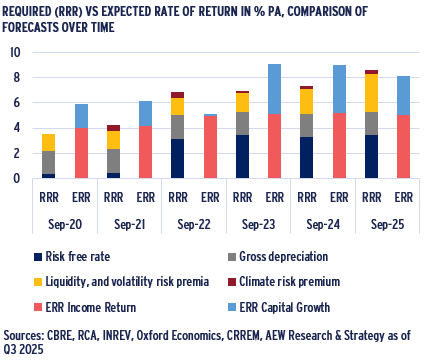
- A short retrospective of our relative value analyses over the last six years confirms some interesting trends.
- First, the ERR has trended mostly up except for Sep-22, when our forecasts assumed yield widening and very little capital value appreciation.
- Second, the RRR has also increased over the last six years, which happened in two distinct phases. In Sep-22 the risk -free rates had increased from near zero to 3.2%.
- In Sep-25, our liquidity and volatility premium increased to 300bps from 200bps the year before.
- This is triggered by our backward-looking liquidity premium estimate based on historical 5-year deal volumes, which now includes the lower 2023-25 volumes.
- This methodological approach is difficult at a time when the actual market liquidity seems to be improving, but since we cannot forecast volumes per market there is no alternative.
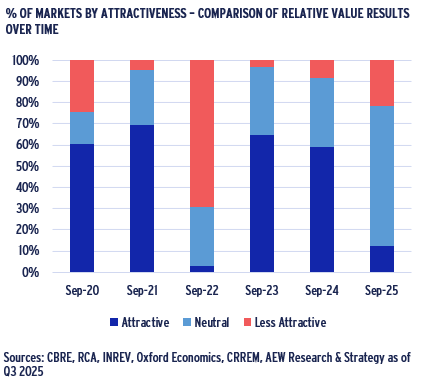
MAJOR SHIFT TOWARDS NEUTRAL RELATIVE VALUE CLASSIFICATION
- The higher liquidity premium and lower expected returns have pushed the number of markets in the attractive category down from 99 in the Sep-24 results to 21 (or 13% of all markets) in the Sep-25 update.
- Two thirds of European property markets are now classified in the neutral category.
- At the same time, the number of less attractive markets has increased from 14 to 36 (21% of all markets).
- These results are not as positive as in the Sep-23 and Sep-24 editions but remain stronger than in 2022 at the time of the rise in interest rates.
- In terms of property sectors, the current analysis for 2026-2030, the office and retail sectors are most represented in the attractive category
- By contrast, low-yielding residential markets tend to be overrepresented in the less attractive category.
- Finally, it is useful to remind ourselves that investors are still making or exceeding their required rates of returns in nearly 80% of covered markets.
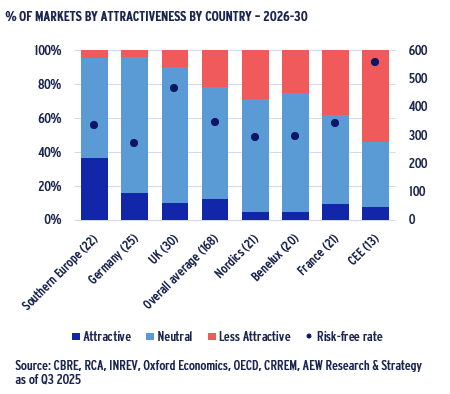
SPAIN & GERMANY TOP RELATIVE VALUE RANKING
- Across all 20 countries covered, our Sep-25 projections imply that investors should meet or exceed the RRR in 79% of market segments, down from 92% in Sep-24.
- In the most attractive country group, Southern Europe, 8 of 22 markets are classified as attractive and 13 are neutral with one market segment categorised as less attractive.
- Within Southern Europe, Spain is the main outperformer.
- Germany is second, where our analysis shows four attractive markets, with 20 marked neutral and one less attractive.
- The UK ranked third with three less attractive markets, 24 neutral and three less attractive segments out of 30.
- CEE came last with only one attractive, five neutral and seven of 13 markets classified as less attractive.
- This sub-region is particularly impacted by higher risk-free rates and therefore has lower excess spreads of ERR over RRR.
- 36 of 168 (or 21%) European markets covered are classified as less attractive, up from 8% in Mar-25. Therefore, investors are expected to meet or exceed the RRR for near 80% of markets.
MORE SELECTIVE MARKET TARGETING REQUIRED AT THIS PHASE
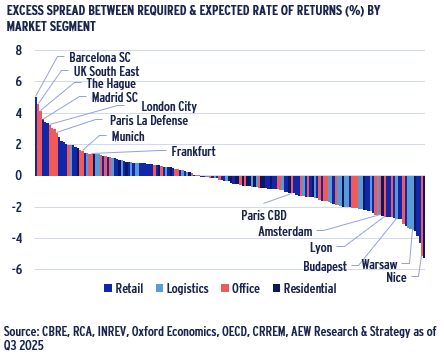
- In the current more neutral overall market classification, investors need to be more focused on city-sector segment specific results as shown in the chart.
- Critical targeting is needed since the range of excess spreads across our European coverage of 168 segments is between minus 500bps and a positive 500bps.
- Some noted over-achievers are Barcelona and Madrid shopping centres, UK South East and The Hague offices.
- On the other hand, Nice and Lyon offices as well as Warsaw and Budapest logistics show negative excess spread.
- Given that the average excess spread is nearly -33bps, this means that some markets show negative excess spreads at near five times the European average.
- This wide range of individual markets’ excess spreads reinforces the experienced manager’s ability for careful selection of sub-markets (and individual deals) at this phase.
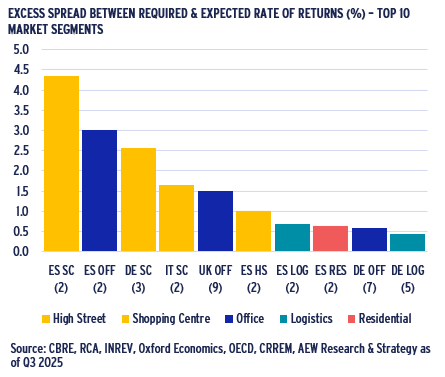
RETAIL HAS FOUR OF TOP TEN MARKET RANKING
- Retail stand out in our latest ranking of market segments based Relative value excess spread (bps of ERR > RRR) with 4 of the top 10 even if all core property types are included.
- Spanish shopping centres rank top with German and Italian shopping centres and Spanish and UK offices in the top 5.
- Spanish high street retail, logistics and residential are in 6th, 7th and 8th positions followed by German offices and logistics to complete our full top ten ranking.
- Top ranked Spanish shopping centre markets have an excess spread of near 435bps.
- Spain is the most featured country in our excess spread top 10 ranking with all five sectors followed by Germany with three sectors and Italy and UK with one sector each.
- Again, the prevailing beds and sheds preference is not really confirmed by the only three segments in our top ten ranking.
Further yield tightening in these two sectors have pushed down the ERR reducing the spreads over an elevated RRR.
This material is intended for information purposes only and does not constitute investment advice or a recommendation. The information and opinions contained in the material have been compiled or arrived at based upon information obtained from sources believed to be reliable, but we do not guarantee its accuracy, completeness or fairness. Opinions expressed reflect prevailing market conditions and are subject to change. Neither this material, nor any of its contents, may be used for any purpose without the consent and knowledge of AEW. There is no assurance that any prediction, projection or forecast will be realized.